0
Trading (financial/stock market trading) is one of the most common ways for people all over the world to make money by using financial products and services to increase their wealth!
Market Monitoring Skills, Special Tools to Watch and Follow Trade Types, and an in-depth awareness of market patterns and scripts are all required to make money in the stock trading marketplace.
To succeed in this dynamic and volatile industry of financial trading, you must have the correct attitude!
Having industry research and market analysis skills is always beneficial for traders because it aids in building stronger decision-making skills, or rather, the ability to make the best call at the right time.
There are numerous tools, patterns, charts, and technical indicators available in today's digital world to assist you in your quest to generate money!
The “Ichimoku Kinko Hyo” (in Japanese) and the “Ichimoku Trading Strategy” (in English) are two very powerful strategic instruments.
Ichimoku Cloud's Father, Goichi Hosoda
The Ichimoku Cloud Trading Strategy is a series of technical indicators that show you the current session's support and resistance levels. At the same time, it assists you in determining the trend's momentum and direction. It works in the same way as the Japanese Candlestick Charting System. However, it has more data points than a standard chart! “Ichimoku” is a Japanese word that means “One Look.” This term refers to how this method allows you to assess support and resistance levels in a single perspective. This technique was created in the 1960s by a Japanese journalist named Goichi Hosoda.
Goichi Hosoda did a thorough job covering rice markets. He chartered prices at this time and eventually devised a new idea of support and resistance! He planned to develop a systematic strategy to market appraisal by the end of the 1930s! So he organised a group of students to work on the computer, and the outcome was Ichimoku Kinko Hyo, which was published in 1968.
Trading Strategy Using Ichimoku Clouds
Perhaps the most accurate and time-saving approach is the Ichimoku Trading Strategy! This approach plots various averages on a graph. At the same time, the Ichimoku indicator analyses the data to calculate a ‘cloud' in order to predict a precise place where the price of the script might find support or resistance on a future day! It may appear to be a little complicated at first. You might possibly be perplexed and have trouble reading the lines! However, if you learn to read them and comprehend the mathematics, you will be able to correctly decipher trade signals!
The Cloud Formulae of Ichimoku
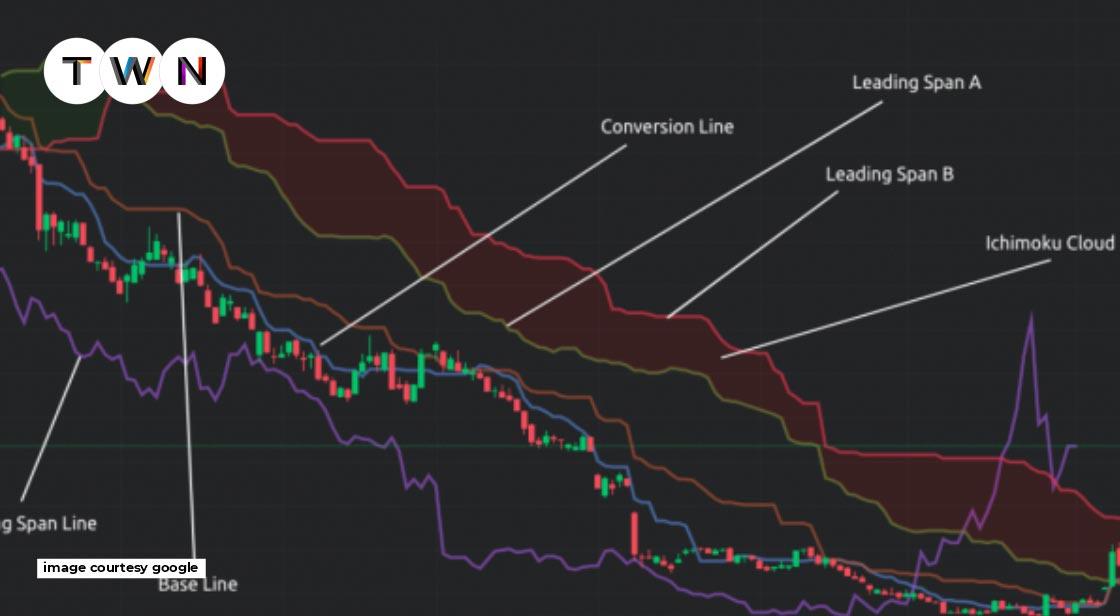
There are five lines in the Ichimoku Cloud. A ‘cloud' is formed by two of these lines. The distinction between the two lines is highlighted! The following are the five lines: a nine-period average | a 26-period average | a 52-period average | a lagging closing price line | and a combination of these two averages
The following are the five formulas for the lines that make up the Ichimoku Cloud Indicator:
2 Base Line (Kinjun Sen)=(26-PH +26-PL) / 2 Leading Span A (Senkou Span A) = (CL + Base Line) / 2 Leading Span B (Senkou Span B) = (52-PH + 52-PH) / 2 Lagging Span (Chikou Span) = Close 26 historical periods were plotted.
Note: CL = Conversion Line | PH = Period High | PL = Period Low
The Ichimoku Cloud: How to Calculate It!
When we compute Ichimoku, we use highs and lows to represent high and low trading prices, respectively. For example, if we analyse the Conversion Line, it may be the greatest or lowest price in the last 9 days. If you want to view the results quickly, you can add the Ichimoku Cloud Indicator to your calculation chart right away! However, if you want to do it yourself, it is not a difficult process. You'll be in the cloud in just seven steps.
- Calculate the Conversion Line and the Base Line first.
- Calculate the leading Span A using the previous calculations. After you've finished the calculation, you'll have data points plotted for 26 times in the future.
- Calculate the Leading Span B and plot it 26 periods in the future, much like the Span A. Now it's time for the Lagging Span! To do so, correctly plot the closing price for the last 26 periods on your Technical Analysis chart.
- It's worth noting that the distinction between Span A and Span B is coloured! It's what gives rise to the ‘Cloud'!
- Then, because the Leading Span A is higher than the Leading Span B, colour the cloud green! It denotes an increase in price. If the Leading Span A appears below the Leading Span B, the opposite is true. Red is the colour of choice! It indicates that prices are falling!
- The six steps above will now result in a single data point. When each point ends, go back to the previous step to create the lines! It will assist you in generating fresh data points for each time. Finally, you'll be able to link all of the data points and draw the lines and clouds.
Tags:
ichimoku trading strategy, ichimoku cloud trading strategy, ichimoku trading strategies


