
P-values help researchers assess whether observed results provide evidence against a null hypothesis. They are commonly used in statistical hypothesis testing to determine whether an observed result is consistent with what might be expected by chance under the null hypothesis.
Understanding how to calculate and interpret p-values helps researchers avoid treating statistical significance as proof of a particular conclusion.
What Is a P-Value?
A p-value represents the probability of obtaining a test result at least as extreme as the observed result, assuming that the null hypothesis is true.
A smaller p-value indicates that the observed data would be less compatible with the null hypothesis under the statistical model being used. However, a p-value does not measure the probability that the null hypothesis itself is true.
For example, researchers comparing two groups may use a hypothesis test to determine whether the observed difference provides sufficient statistical evidence against the assumption that there is no difference.
How Is a P-Value Calculated?
The calculation depends on the statistical test being used. Common tests include t-tests, chi-square tests, ANOVA, and correlation tests.
The general process involves:
- Define the hypotheses: Establish the null hypothesis and alternative hypothesis.
- Select a statistical test: Choose a test that matches the research question, data type, and study design.
- Calculate the test statistic: Use the sample data to calculate the relevant statistic.
- Determine the p-value: Compare the test statistic with its reference distribution under the null hypothesis.
- Interpret the result: Consider the p-value alongside the significance level and other relevant evidence.
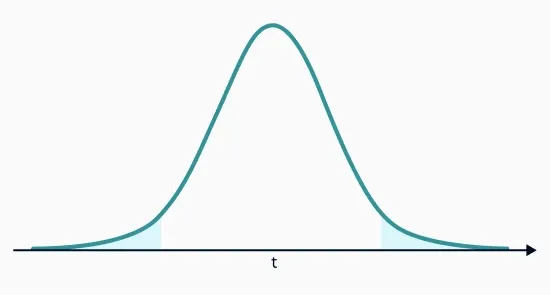
For example, a two-sided t-test may produce a test statistic that is compared with the t-distribution to determine the corresponding p-value.
How to Interpret a P-Value
Researchers often compare the p-value with a predetermined significance level, commonly 0.05.
- P-value ≤ 0.05: The result is typically described as statistically significant at the 5% level, providing evidence against the null hypothesis.
- P-value > 0.05: The result is typically described as not statistically significant at the 5% level.
These interpretations depend on the selected significance level and the assumptions of the statistical test.
A statistically significant result does not necessarily mean the observed effect is large or practically important. Researchers should also consider effect size, confidence intervals, sample size, and the context of the study.
How Can a P-Value Calculator Help?
A P-value calculator may simplify the process of obtaining a p-value when the appropriate statistical inputs are available. Depending on the tool, users may enter values such as a test statistic, sample size, degrees of freedom, or relevant summary statistics.
Such calculators may reduce manual calculation and help researchers check statistical results. However, a calculator does not determine which statistical test is appropriate or whether the underlying assumptions have been satisfied.
Common Mistakes When Interpreting P-Values
Several mistakes may lead to misleading conclusions:
- Treating a p-value as the probability that the null hypothesis is true.
- Assuming statistical significance means the effect is practically important.
- Choosing a significance level after seeing the results.
- Ignoring the assumptions of the selected statistical test.
- Focusing only on p-values without considering effect sizes and confidence intervals.
Conclusion
P-values provide a useful part of statistical hypothesis testing when interpreted within the appropriate research context. Their meaning depends on the null hypothesis, statistical test, assumptions, and significance level used. Researchers should avoid viewing a p-value as a standalone measure of importance or truth. Survey and research platforms such as Sogolytics may support structured data collection and analysis, while statistical tools may assist with specific calculations and interpretation.
























Sign in to leave a comment.