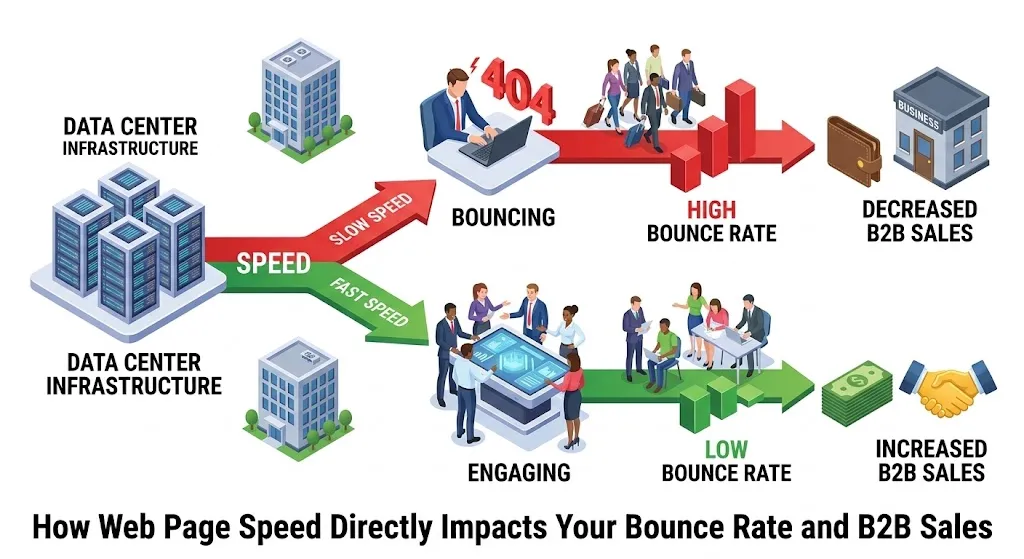

Slow pages lose buyers before they read a word. Google's research shows bounce probability rises 32% as load time grows from 1 second to 3 seconds, and Portent found a B2B site that loads in 1 second converts at 3x the rate of a 5-second site and 5x the rate of a 10-second site.
Every extra second on your demo page, pricing page or case study is a tax on pipeline you already paid to generate. Below are the numbers, the metrics that matter, and the order we would fix things in.
The numbers at a glance
- 1s to 3s load time: bounce probability up 32% (Google)
- 1s vs 5s B2B site: 3x higher conversion rate (Portent)
- 0.1s faster on mobile: 21.6% more users reached the form submission page on lead generation sites (Google, 55 and Deloitte)
- 67% of B2B buyers prefer a rep-free buying experience (Gartner, 2026)
Why does page speed affect bounce rate?
Buyers judge your competence by how fast your site responds. A blank screen during a vendor search reads as friction, and a comparison shopper has four other tabs open.
There is also a measurement reason most articles miss. In GA4, bounce rate is the share of sessions that were not engaged, and a session only counts as engaged if it lasts at least 10 seconds, includes a second page view, or fires a key event.
So if your page takes four seconds to show useful content, the visitor has only six seconds left to cross that line. Slow load time inflates your bounce rate in real behavior and in your reports.
The drop-off is steep, not gradual
Google's mobile data shows bounce probability rising 123% as load time goes from 1 to 10 seconds. The first few seconds do most of the damage, which is why cutting 1.5 seconds from a 4-second page usually beats cutting 0.3 seconds from a 1.2-second page.
How does slow page speed cost B2B sales?
B2B buyers now do most of their research without talking to you. Gartner's 2026 survey found 67% of B2B buyers prefer a rep-free experience, and 45% used AI during a recent purchase. Your website is the sales rep for most of the journey.
When that rep is slow, three things happen:
- Fewer form fills. Portent's B2B lead generation data shows average conversion near 40% at a 1-second load, dropping to 34% at 2 seconds and 29% at 3 seconds.
- Fewer funnel steps completed. In the Deloitte study, lead generation sites saw progress from homepage to the first form step rise 5.5% after a 0.1-second improvement.
- More expensive paid traffic. Google Ads counts landing page experience as one of three Quality Score components, so slow landing pages can push your cost per lead up.
A quick revenue illustration
Say your demo page gets 5,000 visits a month and converts at 2%. That is 100 demo requests. With a 20% close rate and a $15,000 average deal, that page is worth $300,000 a month in closed revenue.
A 10% lift in form completions from a faster page adds 10 demos, roughly $30,000 in monthly revenue at the same close rate. Swap in your own numbers. The logic holds at almost any deal size.
Which speed metrics actually matter?
Google measures page experience through three Core Web Vitals: LCP for loading, INP for responsiveness and CLS for visual stability.
| Metric | What it measures | Good | Poor |
|---|---|---|---|
| Largest Contentful Paint (LCP) | When the main content appears | 2.5s or less | Over 4.0s |
| Interaction to Next Paint (INP) | How fast the page reacts to clicks and typing | 200ms or less | Over 500ms |
| Cumulative Layout Shift (CLS) | How much the layout jumps while loading | 0.1 or less | Over 0.25 |
These targets are assessed at the 75th percentile of real users. INP replaced First Input Delay as a Core Web Vital in March 2024 and is a much stricter test.
INP matters a lot in B2B. Multi-step forms, ROI calculators and pricing toggles are interaction-heavy, and a laggy form field feels broken to the person filling it in.
As a ranking factor, keep expectations realistic. Google's Martin Splitt has described Core Web Vitals as a very small factor in most cases. The bigger payoff from speed is conversion, not rankings.
Where do B2B websites lose the most speed?
The same problems show up in B2B speed audits again and again:
- Third-party scripts. Chat widgets, intent tracking, heatmaps, cookie banners and A/B testing tools each add main-thread work, and together they are the most common cause of poor INP.
- Heavy hero sections. Autoplay background videos and uncompressed hero images delay LCP on the page buyers see first.
- Lazy-loading the wrong image. Lazy-loading the LCP image pushes the main content back.
- Embedded forms from marketing automation tools. Forms that load inside iframes often render last, so the conversion point is the slowest part of the page.
- Slow hosting and no CDN. A high Time to First Byte delays everything after it, especially for international buyers.
How to improve page speed for B2B conversions
Start with the pages closest to revenue, not the homepage. When Blue Core Solutions runs a speed audit for a B2B client, the work starts with the demo request page, pricing page and top case studies, because that is where a faster load turns into pipeline soonest.
1. Find your revenue pages. In GA4, list the landing pages that drive the most key events: demo requests, contact forms and trial sign-ups.
2. Check field data, not just lab scores. Use the Core Web Vitals report in Google Search Console and the CrUX field data in PageSpeed Insights. A Lighthouse score of 95 means little if real mobile users see a 4-second LCP.
3. Fix LCP first.
- Compress the hero image and serve it as WebP or AVIF
- Preload the LCP image and never lazy-load it
- Replace autoplay hero videos with a static image and a play button
4. Cut third-party script weight.
- Remove tools nobody has opened in 90 days
- Load chat widgets only after a user interacts or after a short delay
- Move tags behind consent where the law requires it
5. Fix layout shift. Set explicit width and height on images, iframes and video, and reserve space for cookie banners and embedded forms.
6. Make forms native. Rebuild key forms as native HTML that posts to your CRM instead of a heavy embedded iframe.
7. Monitor monthly. Speed degrades as new tags, plugins and content are added. Set a performance budget and check it before every launch.
How to measure the revenue impact of page speed
Most teams track speed and conversions in separate tools, so they never prove the connection. Here is a simple way to link them:
- Send real-user LCP and INP values into GA4 with the open-source web-vitals JavaScript library
- Segment demo page sessions by LCP band: under 2.5s, 2.5 to 4s, and over 4s
- Compare engagement rate and form completion rate across those bands
- Pass the data into your CRM to see whether faster sessions also produce more qualified opportunities
This gives finance and leadership a speed-to-pipeline number instead of a performance score.
Frequently asked questions
How does page speed affect bounce rate?
Slower pages raise bounce rate because visitors leave before content appears. Google's data shows bounce probability rises 32% as load time grows from 1 to 3 seconds. In GA4, a slow page also shrinks the 10-second window a visit needs to count as engaged.
What is a good page load time for a B2B website?
Aim for a Largest Contentful Paint of 2.5 seconds or less for at least 75% of real visits. Portent's data shows B2B conversion rates are highest when pages load in 1 to 2 seconds.
Does page speed affect B2B lead generation?
Yes. Portent found a B2B site that loads in 1 second converts 3x better than one that loads in 5 seconds. A Google study with Deloitte found that a 0.1-second improvement increased progress to form submission on lead generation sites.
Is page speed a Google ranking factor?
Core Web Vitals are part of Google's page experience signals, but Google describes their ranking effect as small in most cases. The larger benefit of a faster site is higher engagement and more conversions.
What is the difference between LCP and INP?
LCP measures how quickly the main content of a page appears. INP measures how quickly the page responds when someone clicks, taps or types. Both are Core Web Vitals.
Which pages should a B2B company speed up first?
Start with the pages closest to revenue: demo request, pricing, contact and top case studies. These pages have the clearest link between faster load times and more pipeline.



















Sign in to leave a comment.