Welcome to the exciting world of trading strategies! If you're looking to level up your game and explore new ways to analyze market trends, then you've come to the right place. In this blog post, we'll be delving into the Hull Moving Average (HMA) strategy – a powerful tool that can help traders make more informed decisions.
What exactly is the Hull Moving Average? How does it work? And why should you consider using it in your trading arsenal? We'll answer all these questions and more as we dive into the intricacies of this popular indicator. So fasten your seatbelts and get ready for an illuminating journey through the world of HMA!
But first, let's clarify what exactly is a moving average. A moving average is a widely used technical analysis tool that smooths out price data by creating a constantly updated average price over a specific period. By doing so, it helps traders identify trends and potential reversal points.
Now that we have our foundation laid out, let's move on to exploring how HMA takes things up a notch with its unique formula and breakout strategy. Stick around because there's plenty of valuable information coming your way!
What is hull moving average (HMA)?
The Hull Moving Average, or HMA for short, is a technical analysis indicator that aims to provide traders with a smoother and more responsive moving average line. Developed by Alan Hull, it takes into consideration the weighted moving average (WMA) and exponential moving average (EMA) to create its unique formula.
So what sets the HMA apart from other moving averages? Well, unlike traditional MAs that simply calculate an average based on closing prices, the HMA incorporates both price data and time period. This allows it to better adapt to market volatility and filter out noise.
The formula behind the HMA may seem complex at first glance but fear not! It's actually quite straightforward once you break it down. The calculation involves taking several steps: calculating WMA of half period length, calculating WMA of full period length, doubling them up while subtracting one from another.
By using this intricate formula, the HMA achieves its goal of minimizing lag while still maintaining accuracy in trend identification. The result is a smoother line that closely follows price movements without sacrificing reliability.
Traders often utilize the Hull Moving Average in conjunction with other indicators or as part of a larger trading strategy. Its ability to provide timely signals during market breakouts makes it especially popular among active traders seeking opportunities for profit.
Now that we have explored what exactly is the Hull Moving Average and how it differs from other types of moving averages let us move on to examining its breakout strategy – a technique used by many traders looking for potential entry points in volatile markets. Stick around because there's plenty more valuable information coming your way!
Hull Moving Average trading strategy
Hull Moving Average (HMA) is a popular trading strategy used by traders to identify trends and make informed decisions in the financial markets. Unlike traditional moving averages, HMA aims to reduce lag and provide more accurate signals.
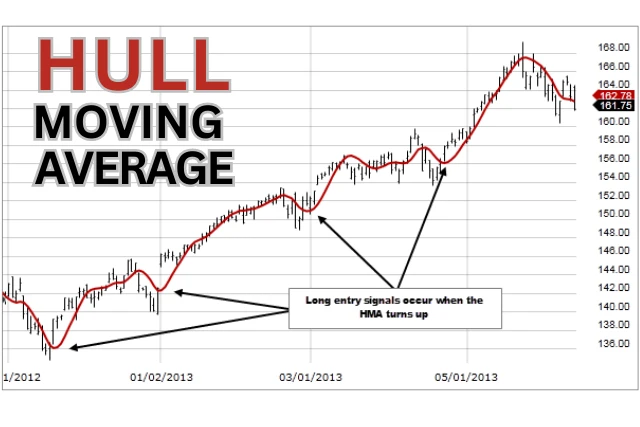
The HMA trading strategy involves using the Hull Moving Average indicator on a price chart. Traders look for crossovers between the HMA line and the price as potential entry points. When the HMA line crosses above the price, it suggests a bullish trend, while a crossover below indicates a bearish trend.
Traders can also use HMA as an exit signal by waiting for the HMA line to cross back over the price in the opposite direction. This helps minimize losses or lock in profits during volatile market conditions.
One advantage of using HMA is its ability to adapt quickly to changing market conditions. The formula behind HMA takes into account different periods of time, making it more responsive to recent price movements.
However, it's important to note that like any trading strategy, there are risks associated with using HMA. False signals can occur during choppy or sideways markets, leading to potential losses if trades are executed solely based on these signals.
In conclusion, Hull Moving Average is an effective tool for traders looking to identify trends and make well-informed trading decisions. By understanding how this indicator works and applying it correctly within their strategy, traders can potentially increase their chances of success in the financial markets
Hull Moving Average breakout strategy
One popular way to use the Hull Moving Average (HMA) is through a breakout strategy. This strategy aims to identify potential trend reversals or continuations by looking for breakouts above or below the HMA line.
To implement this strategy, traders wait for the price to break out of its current range and close either above or below the HMA line. A breakout above suggests a bullish trend, while a breakout below indicates a bearish trend.
The advantage of using the HMA in this strategy is that it filters out noise and provides smoother signals compared to traditional moving averages. This can help traders avoid false breakouts and make more accurate trading decisions.
However, like any trading strategy, there are risks associated with using the HMA breakout strategy. False breakouts can occur, leading to losses if trades are entered prematurely. It's important for traders to combine this strategy with other indicators or technical analysis tools for confirmation before taking action.
The Hull Moving Average breakout strategy is an effective tool for identifying potential market trends and making informed trading decisions. However, it should be used in conjunction with other indicators and careful analysis to minimize risks and maximize profitability.
Why choose HMA?
Why choose HMA? Well, there are several reasons why the Hull Moving Average (HMA) is a popular choice among traders.
The HMA is known for its ability to provide smoother and more accurate trend signals compared to traditional moving averages. This is because it incorporates weighted calculations that give more weightage to recent price data, making it responsive to market changes.
The HMA can be customized based on individual preferences. Traders have the flexibility to adjust parameters such as period length and smoothing factor according to their trading style and time frame.
Furthermore, the HMA breakout strategy has gained popularity due to its potential for identifying significant price movements. By using multiple time frames or combining with other indicators, traders can spot breakouts and enter trades at optimal levels.
Moreover, HMA can be used effectively in different financial markets such as stocks, forex, commodities, and cryptocurrencies. Its versatility makes it suitable for both short-term scalping strategies and long-term investment approaches.
Lastly but importantly, Hull Moving Average formula provides a clear visual representation of trends by plotting smooth curves on price charts. This helps traders make informed decisions based on trend direction and potential reversals.
In summary, Hull Moving Average offers a unique approach towards trend analysis with smoother signals adaptable across various markets.
It's customizable features combined with breakout strategies make it an appealing choice for many traders seeking reliable indicators
Risks Associated with HMA
While the Hull Moving Average (HMA) strategy can be a powerful tool for traders, it's important to be aware of the risks associated with using this indicator. Here are some key considerations:
False Signals: Like any other technical indicator, HMA is not foolproof. It relies on historical data and mathematical calculations, which means there is always a possibility of false signals. Traders should exercise caution and use additional confirmation tools before making trading decisions based solely on HMA.
Market Volatility: HMA works best in trending markets where price moves in a consistent direction. However, during periods of high market volatility or choppy price action, the moving average may produce erratic signals that could lead to losses.
Lagging Indicator: One downside of using any moving average is its inherent lagging nature. The Hull Moving Average attempts to reduce this lag by using weighted averaging techniques; however, it still lags behind current prices to some extent. Traders need to be mindful of this delay and adjust their strategies accordingly.
Over-optimization: Another risk associated with using HMA (or any other trading indicator) is over-optimization – tweaking settings or parameters excessively to fit past data perfectly but failing when applied in real-time trading conditions. This can lead to unrealistic expectations and poor performance in live markets.
Combined Risks: Moreover,Hull Moving Average breakout strategy involves combining multiple indicators like Bollinger Bands or stochastic oscillators which introduces additional complexity and potential risks into the equation.
Traders must thoroughly test these combined strategies before implementing them live.
It's crucial for traders to understand that no single indicator guarantees success in trading; they all come with their own set of risks.
Hence,it's advisable not rely solely on one method but instead combine several approaches while considering risk management techniques such as stop-loss orders,trailing stops,and position sizing
FAQs about Hull Moving Average
What is the Hull Moving Average (HMA)?
The Hull Moving Average (HMA) is a technical indicator that aims to provide a smoother and more accurate representation of price movements compared to traditional moving averages. It was developed by Alan Hull and combines weighted moving averages with an algorithm designed to reduce lag.
How does the HMA trading strategy work?
The HMA trading strategy involves using the crossover of the HMA line with price action as a signal for potential buy or sell opportunities. When the HMA line crosses above the price, it may indicate a bullish trend, while a cross below may suggest a bearish trend.
What is the formula for calculating the HMA?
The formula for calculating the HMA involves several steps, including applying weighted moving averages to eliminate noise and smoothing techniques such as square roots to reduce lag. While it can be complex, there are various online tools and trading platforms that automatically calculate this indicator.
Can I use the HMA breakout strategy in my trading?
Yes! The HMA breakout strategy focuses on identifying periods of low volatility followed by sudden breakouts in price movement. Traders often look for instances where price breaks above or below key levels along with confirmation from indicators like volume or other chart patterns.
Are there any risks associated with using HMA in my trading?
Like any technical indicator, there are inherent risks involved when relying solely on one tool for decision-making in your trades. It's important to remember that no indicator guarantees profits and market conditions can change rapidly.
Are there alternative indicators similar to HMA?
Yes, there are many other types of moving averages available such as Simple Moving Averages (SMA), Exponential Moving Averages (EMA), and Weighted Moving Averages (WEMA). These can all be used depending on your personal preference and trading style.
Remember, incorporating multiple indicators along with thorough analysis and risk management is key to successful trading. Experiment with different strategies


Sign in to leave a comment.