Statistics is a vital part of understanding data, whether you are a student, researcher or professional. SPSS (Statistical Package for the Social Sciences) makes it easier to analyse data, visualise results and draw conclusions. While working with SPSS, you will come across two major types of statistics that are mainly used for specific purposes, and those are: descriptive and inferential. Both are essential, but they serve very different purposes. For that, you have to understand the difference to choose the right approach. You can ask the expert, “Can you help me do my assignment?”. Their experts will guide you to generate high-quality project work by making accurate predictions.
What Is Descriptive Statistics?
Descriptive statistics is all about summarising and organising the data to make it easy to understand. If you have a dataset of students' exam scores, instead of looking at hundreds of individual scores, descriptive statistics help you to find the average score, the highest scores and the lowest scores. The main goal of this method is to identify what is present in your data. It does not make predictions or conclusions about the larger population. It provides a clear picture of the dataset you have.
What Is Inferential Statistics?
Inferential Statistics helps you make predictions and draw conclusions about a huge population based on a smaller sample. For instance, if you collect exam scores from 50 students in a school of 500, inferential statistics allows you to estimate the performance of the 500 students. It uses probability theory and statistical models. If you want to accomplish good research using this method, you can seek Instant Assignment Help.
Key Differences Between Descriptive and Inferential Statistics
Understanding the differences between descriptive & inferential statistics is crucial, especially when using SPSS. With the help of the table below, you will know how you can use these methods effectively:-
Descriptive Statistics-
Purpose-Its primary purpose is to describe and present what the dataset shows, making it easier to understand patterns and variability.
Data used-This method works with the entire dataset that has been collected. All the data points are included in the analysis.
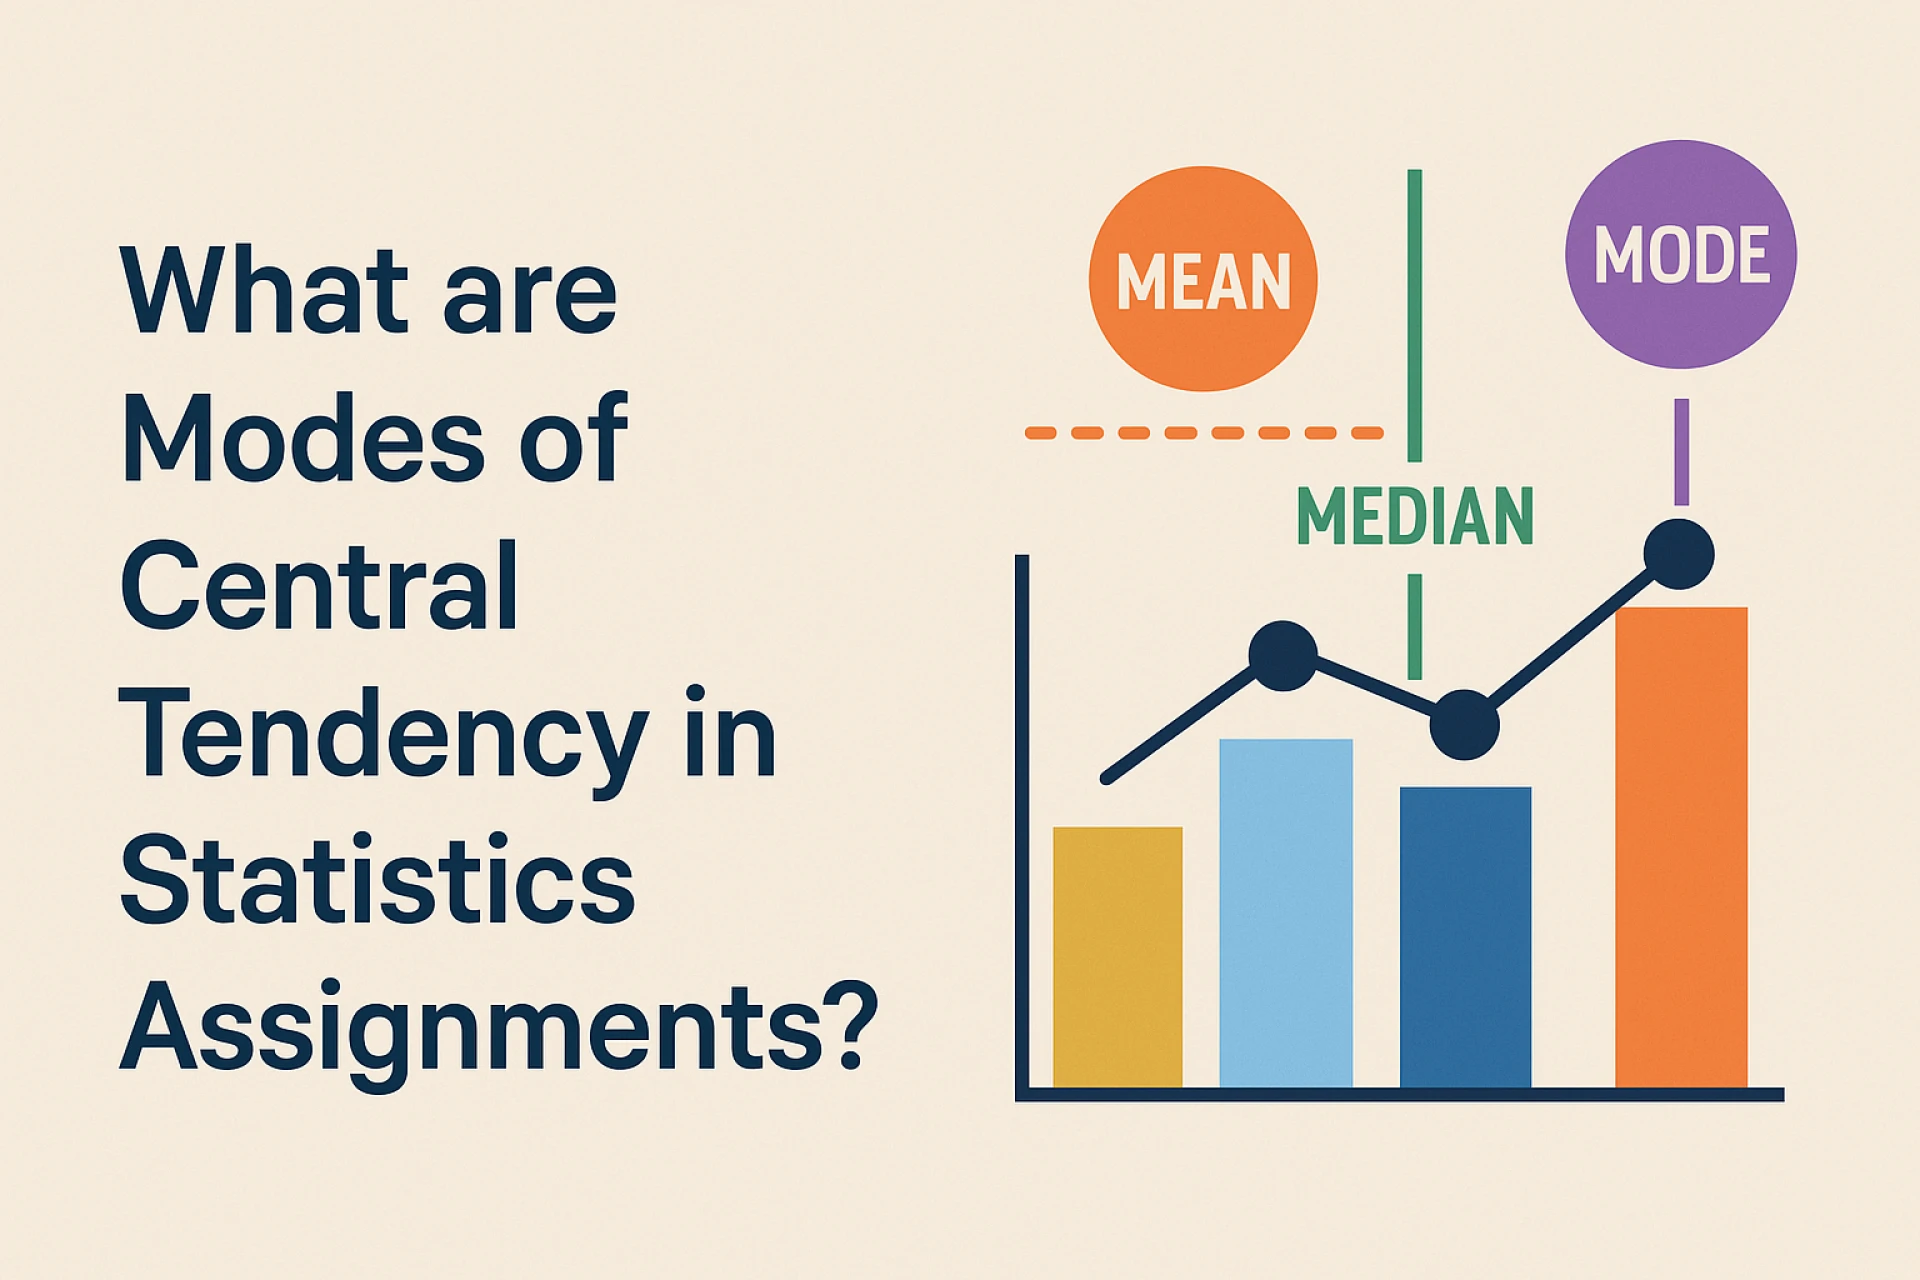
Techniques-Inlcude tools such as mean, mode, median, range, variance, standard deviation and visual tools.
Focus-It focuses on what is present in the dataset and highlights all the trends,patterns and distributions from that data list.
Outcome-Provides summaries, visuals, and insights about the dataset that are easy to understand. It is useful for the reports and presentations.
Applications-Useful for summarising survey results, class reports, research datasets, dashboards and charts. Helps in presenting data clearly without drawing conclusions beyond.
Inferential Statistics-
Purpose-It draws conclusions and makes predictions about a population based on the sample data by helping answer the research questions.
Data used-It works with a subset or sample of the dataset to infer results about the entire population, saving time and resources.
Techniques-Common techniques include t-tests, ANOVA, regression analysis, correlation analysis, and confidence intervals.
Focus-It mainly focuses on what the data implies and predicts, enabling conclusions about the broader population or future trends.
Outcome-Produces predictions, conclusions or test results that guide research, forecasting or decision-making, often with a probability of accuracy.
Applications-Suitable for research studies, predicting outcomes, testing hypotheses, policy making and decision making. It helps in making informed choices.
So, with the help of this table, you now know the difference between these two statistics. If you are writing an assignment, you can use a free grammar checker to identify unnoticed mistakes. Now, let’s learn how you can use them in SPSS. What are the steps?
How to Use Descriptive and Inferential Statistics in SPSS?
SPSS makes it easy for students to work with both descriptive and inferential statistics. Here’s a simple steps to get started with each type:-
1. Descriptive Statistics in SPSS
Step 1:- Open your dataset in SPSS.
Step 2:- Go to Analyse, then to Descriptive Statistics, and after that open Descriptives
Step 3: Then you have to select the variables you want to analyse
Step 4:- Click OK, and SPSS will show you results including Mean, Median, Standard Deviation and more.
Step 5:- You can also create visual summaries by going to Graphs to Chart Builder to make histograms or bar charts.
2. Inferential Statistics in SPSS
Step 1:- Open your dataset in SPSS.
Step 2:- Go to Analyse, then Compare Means, Regression, Correlate, or Nonparametric Tests.
Step 3:- Select your variables, which could be independent or dependent variables for regression.
Step 4:- Click OK, and SPSS will provide outputs including p-values, confidence intervals, coefficients, or correlation values.
Step 5:- Interpret the results: A p-value less than 0.05 usually indicates a significant result.
So, these are the steps of descriptive and inferential statistics methods that you can follow to compile your data.
Final Thoughts
Descriptive and inferential statistics are like two sides of the same coin. Both types are easy to perform in SPSS, making it a powerful tool for students and researchers. For this understanding, the differences mean you can choose the proper method for your analysis and interpret results correctly in a meaningful way. Whether you are writing a homework, projects or research, mastering these concepts will improve your data skills. You can ask experts, “Can you help me do my assignment?”. There are many experts who will help you in generating high-quality work for your academics.
Also Read- How Can One Examine What Occurs When Light Is Absorbed By an Object?


Sign in to leave a comment.