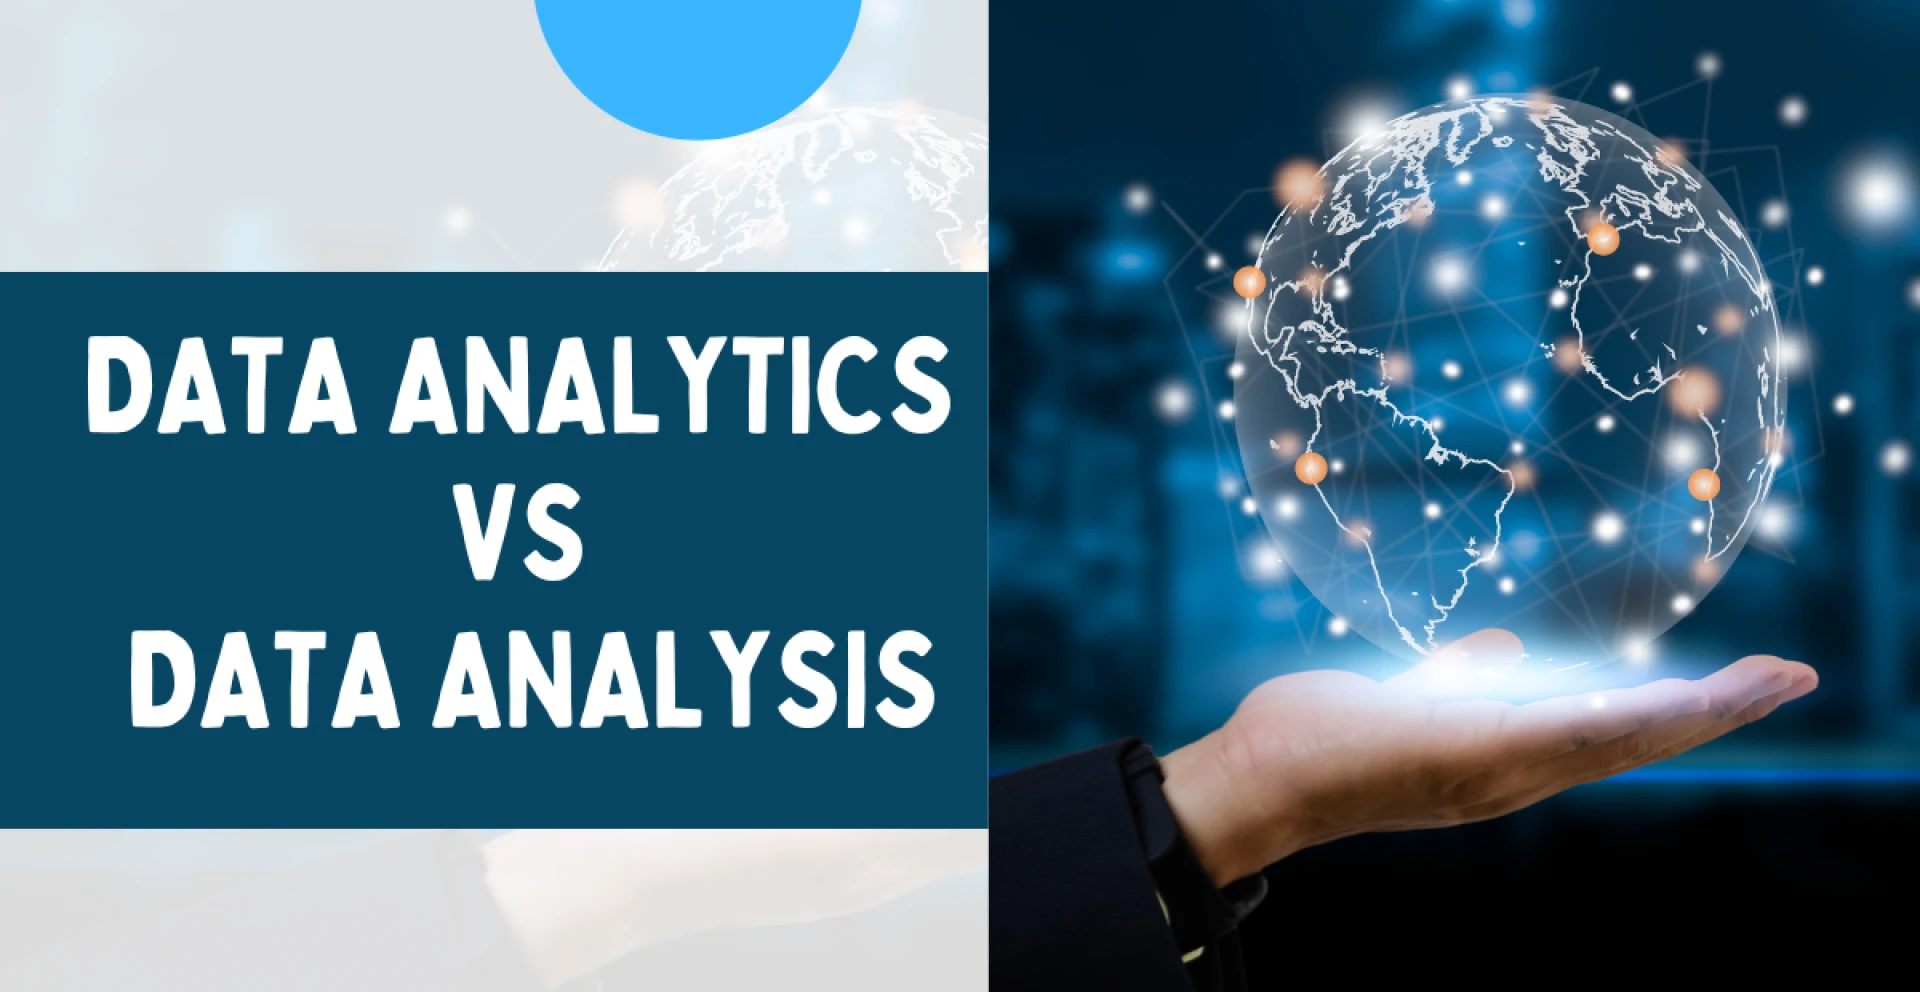
Data Analytics and Data Analysis Both are not the same. Many times people misunderstand that both are the same.
To discuss Data Analytics, a company or business is more focused on the future rather than explaining past results. This includes making sense of data analytics using algorithmic analytics as well as statistics. That means paying attention to future things. Analytics includes finding important information in stored data and all related activities.
Data Analytics is the process of exploring real-world data to make future-proof decisions using key insight tools. Data analytics provides accurate data understanding and insights to improve future operations.
Data Analytics Tools are – Microsoft Excel, SAS, Python, R, Tableau, Apache Spark, RapidMiner, Qlik View, Knime, Talend, Google Fusion Tables, Node Xl, Google Search Operators, MongoDB, Datawrapper, Hadoop, Zoho Analytics, etc.
Process in Data Analytics –
Data Analytics is a Modern type of analysis that uses data to make decisions.
It consists of one or more users who perform data collection and analysis.
Data analytics includes data collection as well as business data analysis.
Data Analytics involves processing data using various technologies such as Tableau, SAS, Python, Excel, Google Analytics, and others.
Data analytics techniques
Regression analysis
These techniques are used to estimate variables accurately. For example, regression analysis is used to accurately determine how many followers a brand has on social media profiles like Facebook and Instagram with their average income in the last 2 years. One thing to remember is that regression analysis is primarily used for prediction. It cannot tell you about actions and consequences.
Factor Analysis
Factor analysis is known to have low results. It helps data analysts to understand people's behavior and the choices they make. Factor Analysis is a type of statistical technique that reduces a set of variables and all their factors into a smaller number of factors. This can also be called data reduction.
Cohort analysis
Cohort analysis is a grouping of users based on characteristics to track and understand their actions. This allows you to ask as many questions as possible and make informed product decisions, thereby increasing revenue significantly.
Cluster Analysis
In cluster analysis, customer data is divided into smaller groups or clusters; Hence, all customer data is handled in one place. For this, companies can look at trends and patterns related to specific groups. By recognizing these patterns, companies can offer services based on businesses.
Data Analysis
Analysis means a careful examination of structural elements. Analysis is a word used to find out why and for what happened. For example, data analysis is done to gain insight or better results on the decline in profit or sales in an organization's business.
Data Analysis is the process of gathering data, analyzing data, transforming data, and transforming it into meaningful and useful information with a focus on modeling and analyzing it to make important decisions and gain business insights. Data Analysts are usually analyzing one or more generated datasets.
Data Analysis is an analysis used in an organization to evaluate data and gain insights.
Data Analysis involves defining data, cleaning data, and transforming it to get useful results.
Raw data must first be defined in a meaningful way before data cleaning and accurate information retrieval can be performed on the data.
Google Fusion Table, Spark, Node XL, Excel, etc. are used for data analysis.
Data Analysis includes data validation, analysis, data storage, etc. Tools used for Data Analysis are Tableau, Excel, SAS, R, Python, Matlab, Spark, Google Fusion Table, Node XL, etc.
Types of Data Analysis - Text Analysis, Statistical Analysis, Diagnostic Analysis, Inferential Analysis,
Predictive analysis, Prescriptive Analysis,
Data Analysis Techniques – A/B Testing, Data Integration and Data Fusion, Data Mining, Machine Learning, Natural Language Processing, Statistics, etc.
Data analysis tools are – Microsoft Power BI, SAP Business Objects, Tableau, Google Data Studio, Metabase, IBM Cognos, RapidMiner, Oracle analytics cloud, R, Python, Excel, etc.
Data Analysis Process / Phases
a) Data Requirement Gathering
If you want to achieve the goal of data analysis, first of all, you have to think, why do data analysis? And what kind of data to analyze? Also for this, you have to use some important tools.
This data requirement analysis process is analyzed using a top-down approach with an emphasis on business needs. This process involves finding and evaluating relevant business data in relation to customer needs. After data requirements are identified, the data story is determined and evaluated using data quality.
There are several steps in the Requirements gathering process
Analyze required participantsStart talkingDevelop personasAnalyze QuestionsScenario mappingGroup similar itemsCheck analytics dataConducting stakeholder interviewsDeveloping source-to-target mappingsa) Data Collection
In this, which sources will be used while collecting data, and do they have to be defined? Data collection is in different forms such as external sources, surveys, interviews, questionnaires, focus groups, and others.
After collecting the data you will have a clear insight into what you want to measure and what your conclusions are. It is important to keep a log of the various sources from which you have collected data, the date of collection, and the data source. One thing to keep in mind is that once the data is collected the collected data needs to be processed or managed for analysis.
b) Data Cleaning
Data cleaning techniques are used to determine whether the data you have stored is useful for your analysis. Because the collected data contains duplicate records and white spaces, it must be free of errors. Importantly, the data cleaning step must be completed prior to analysis so that the output of your analysis is almost as expected.
c) Data Analysis
In data analysis, you can start analyzing and manipulating data using various technologies like statistical analysis, neural networks, text analysis, regression analysis, etc. You can do data analysis with the help of new trends and tools in the market for data analysis.
Various technologies in the market help data analysts and business users in managing their data. Some of them include business intelligence and visualization software, predictive analytics, data mining, etc.
In short, you can use data analysis tools and software that will help you understand, and draw meaningful conclusions as needed.
d) Data Interpretation
Data Interpretation is the most important step in data analysis, to interpret your results. Data Interpretation involves understanding, organizing, and drawing meaningful conclusions from information. Data interpretation is the review and analysis of data and the process of drawing relevant conclusions using methods. Data analytics improves the execution of business processes and gains insights and identifies behaviors.
Conclusion: It is becoming a new source of data for every organization or business. So you can use Data Analytics to enhance your organization's performance so that profits and sales will increase and you will survive in today's age of competition. To accelerate your business with today's growing technology; you need to understand the difference between Data Analytics and Data Analysis. Data Analytics provides insight, which enables understanding of what has happened so far to strengthen business processes. If you’ve been looking to get into a Career in Data Analytics. Learn Data Analytics Training in Pune. Expand your analytical skill set by learning analytical modeling, machine learning, experimentation, forecasting, and optimization.


Sign in to leave a comment.