Introduction
Travel demand spikes every holiday season — but in 2025, fare volatility reached new extremes. Prices changed not just daily, but hourly, influenced by last-minute demand surges, seat inventory shifts, competitive carrier actions, and booking behavior differences across regions.
For OTAs, airlines, and travel brands, understanding how fares move during peak travel windows is no longer optional. It directly impacts:
- Search rankings
- Conversion rates
- Customer acquisition costs
- Cancellation risks
- Revenue optimization
Actowiz Solutions analyzed millions of fare snapshots across India–UAE, India–SEA, USA domestic, and Europe–Middle East routes to uncover real-time patterns that airline APIs simply do not reveal.
This report highlights the biggest fare surges, the fastest drops, and the hidden micro-patterns influencing peak-season revenue.
How Holiday Fare Volatility Works
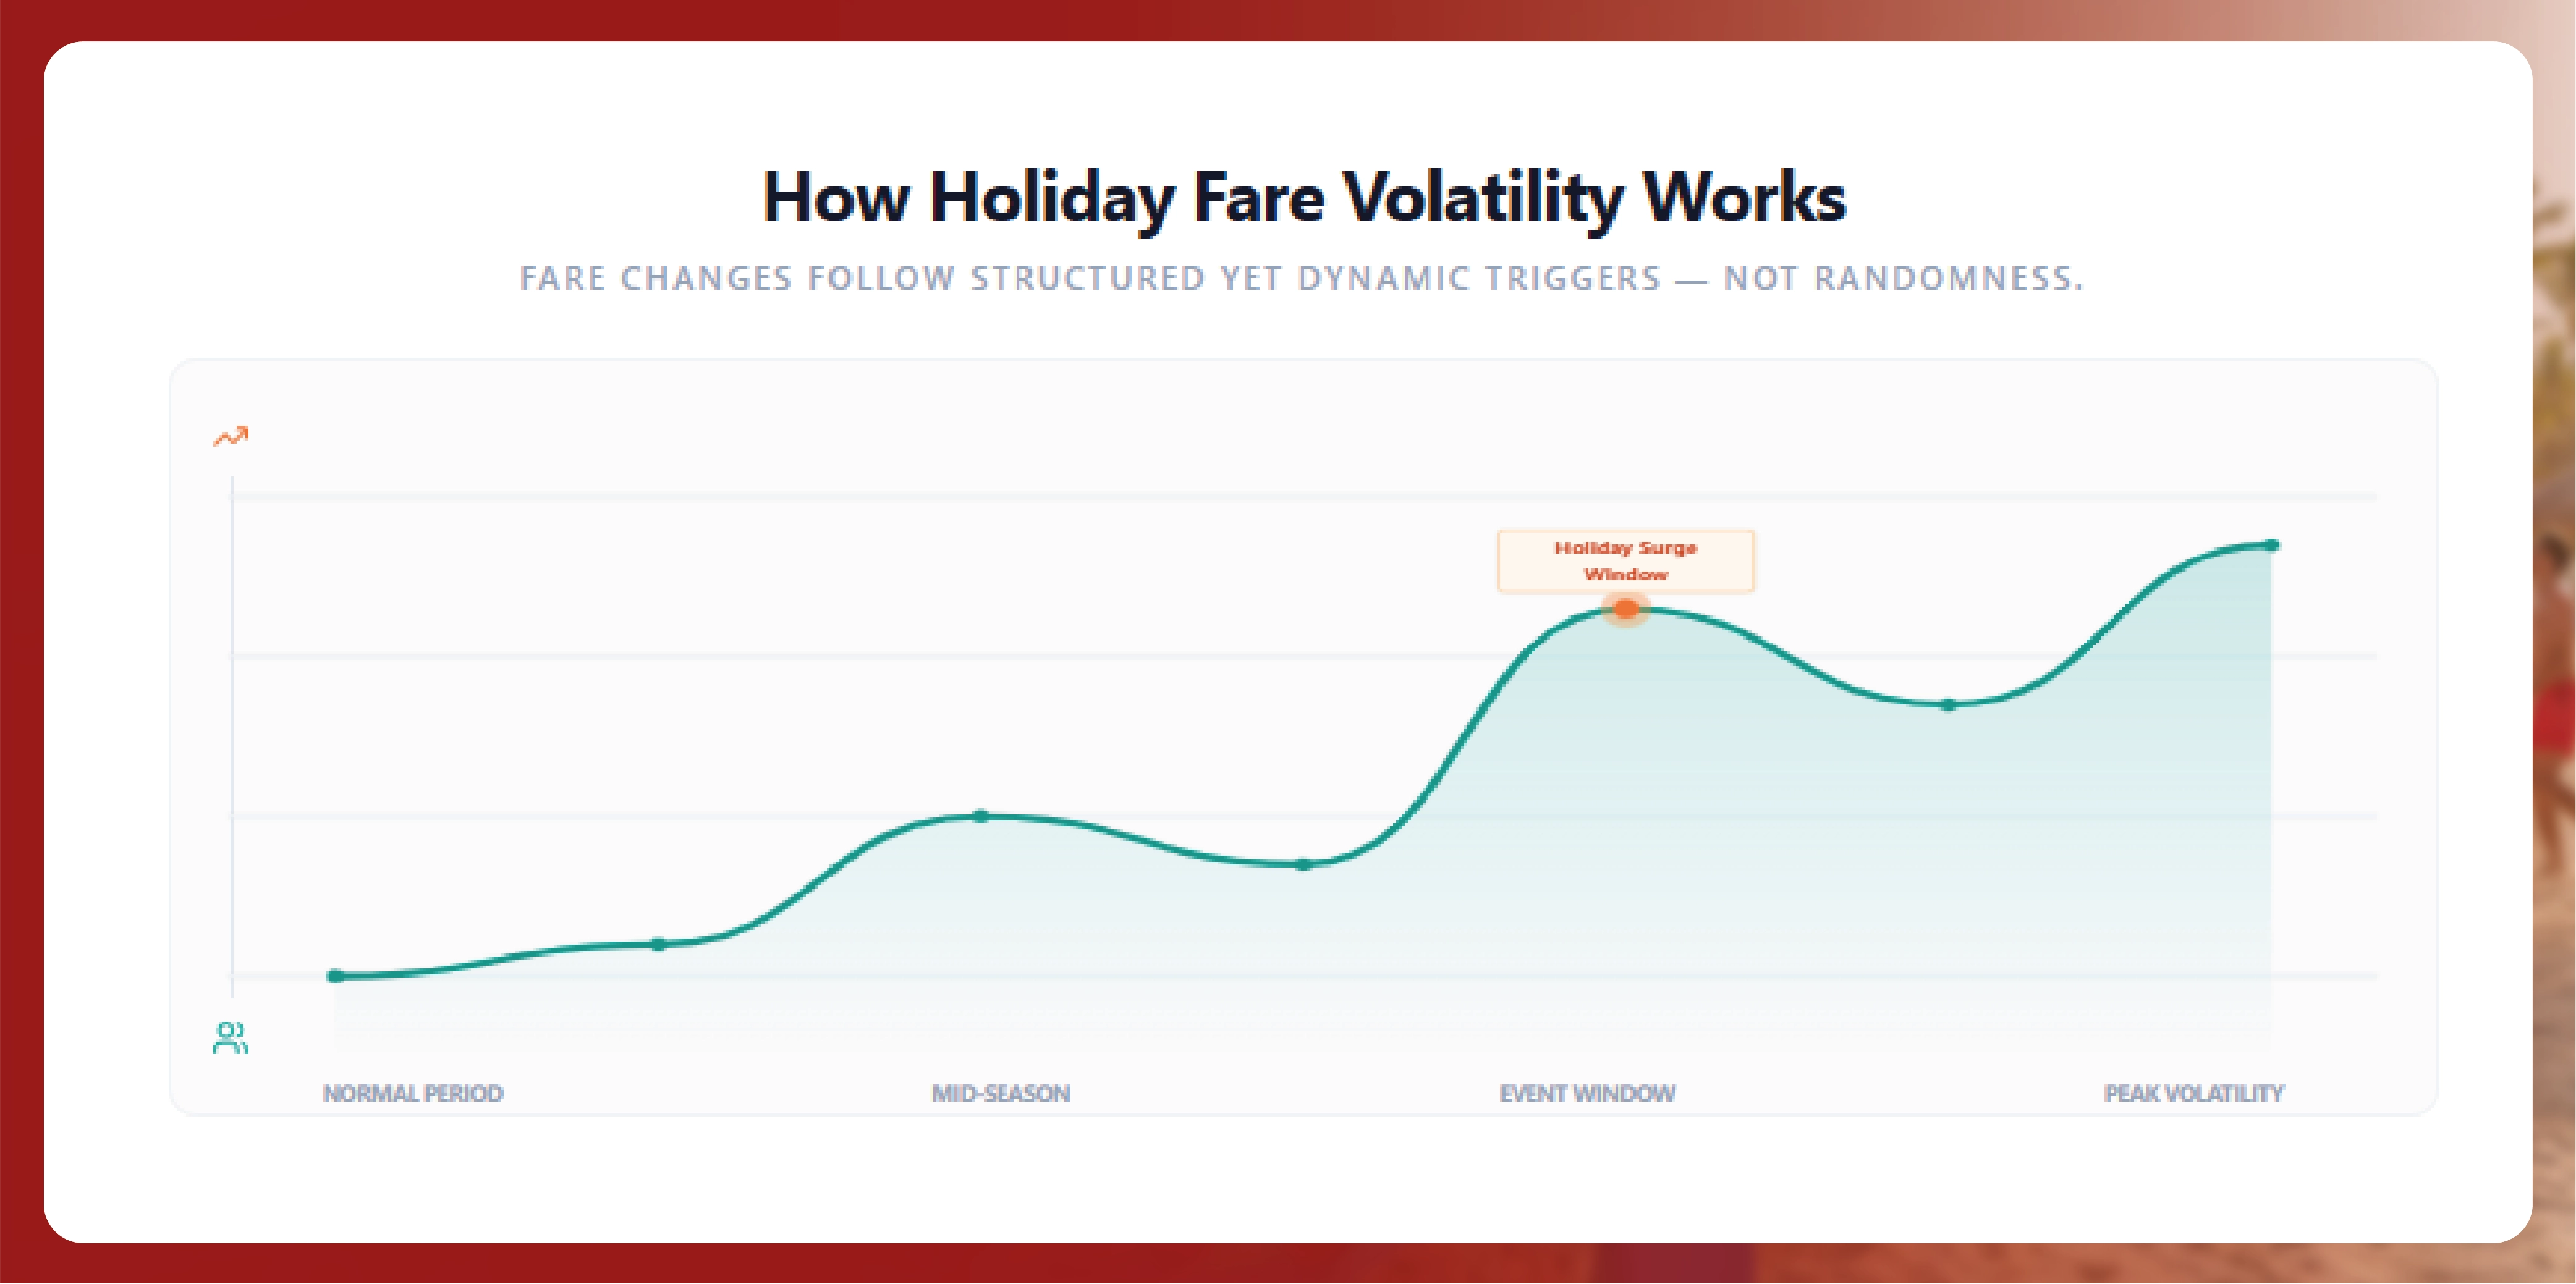
Fare changes are not random — they follow structured but dynamic triggers.
The top volatility drivers include:
- Seat inventory pressure
As occupancy crosses key thresholds (40%, 60%, 80%), airlines adjust fares instantly. - Demand surges
Spikes occur around long weekends, school holidays, and national festivals. - Competitive price drops
One carrier lowering fare by 5–8% can trigger a ripple effect within minutes. - OTA segmentation
Different OTAs may show different fares due to caching delay or rule variations. - Time-of-day pricing
Fares often rise during afternoon and evening search windows.
Seasonal Fare Surge Patterns / Trend Curves
Key Insights From Actowiz’s Real-Time Dataset
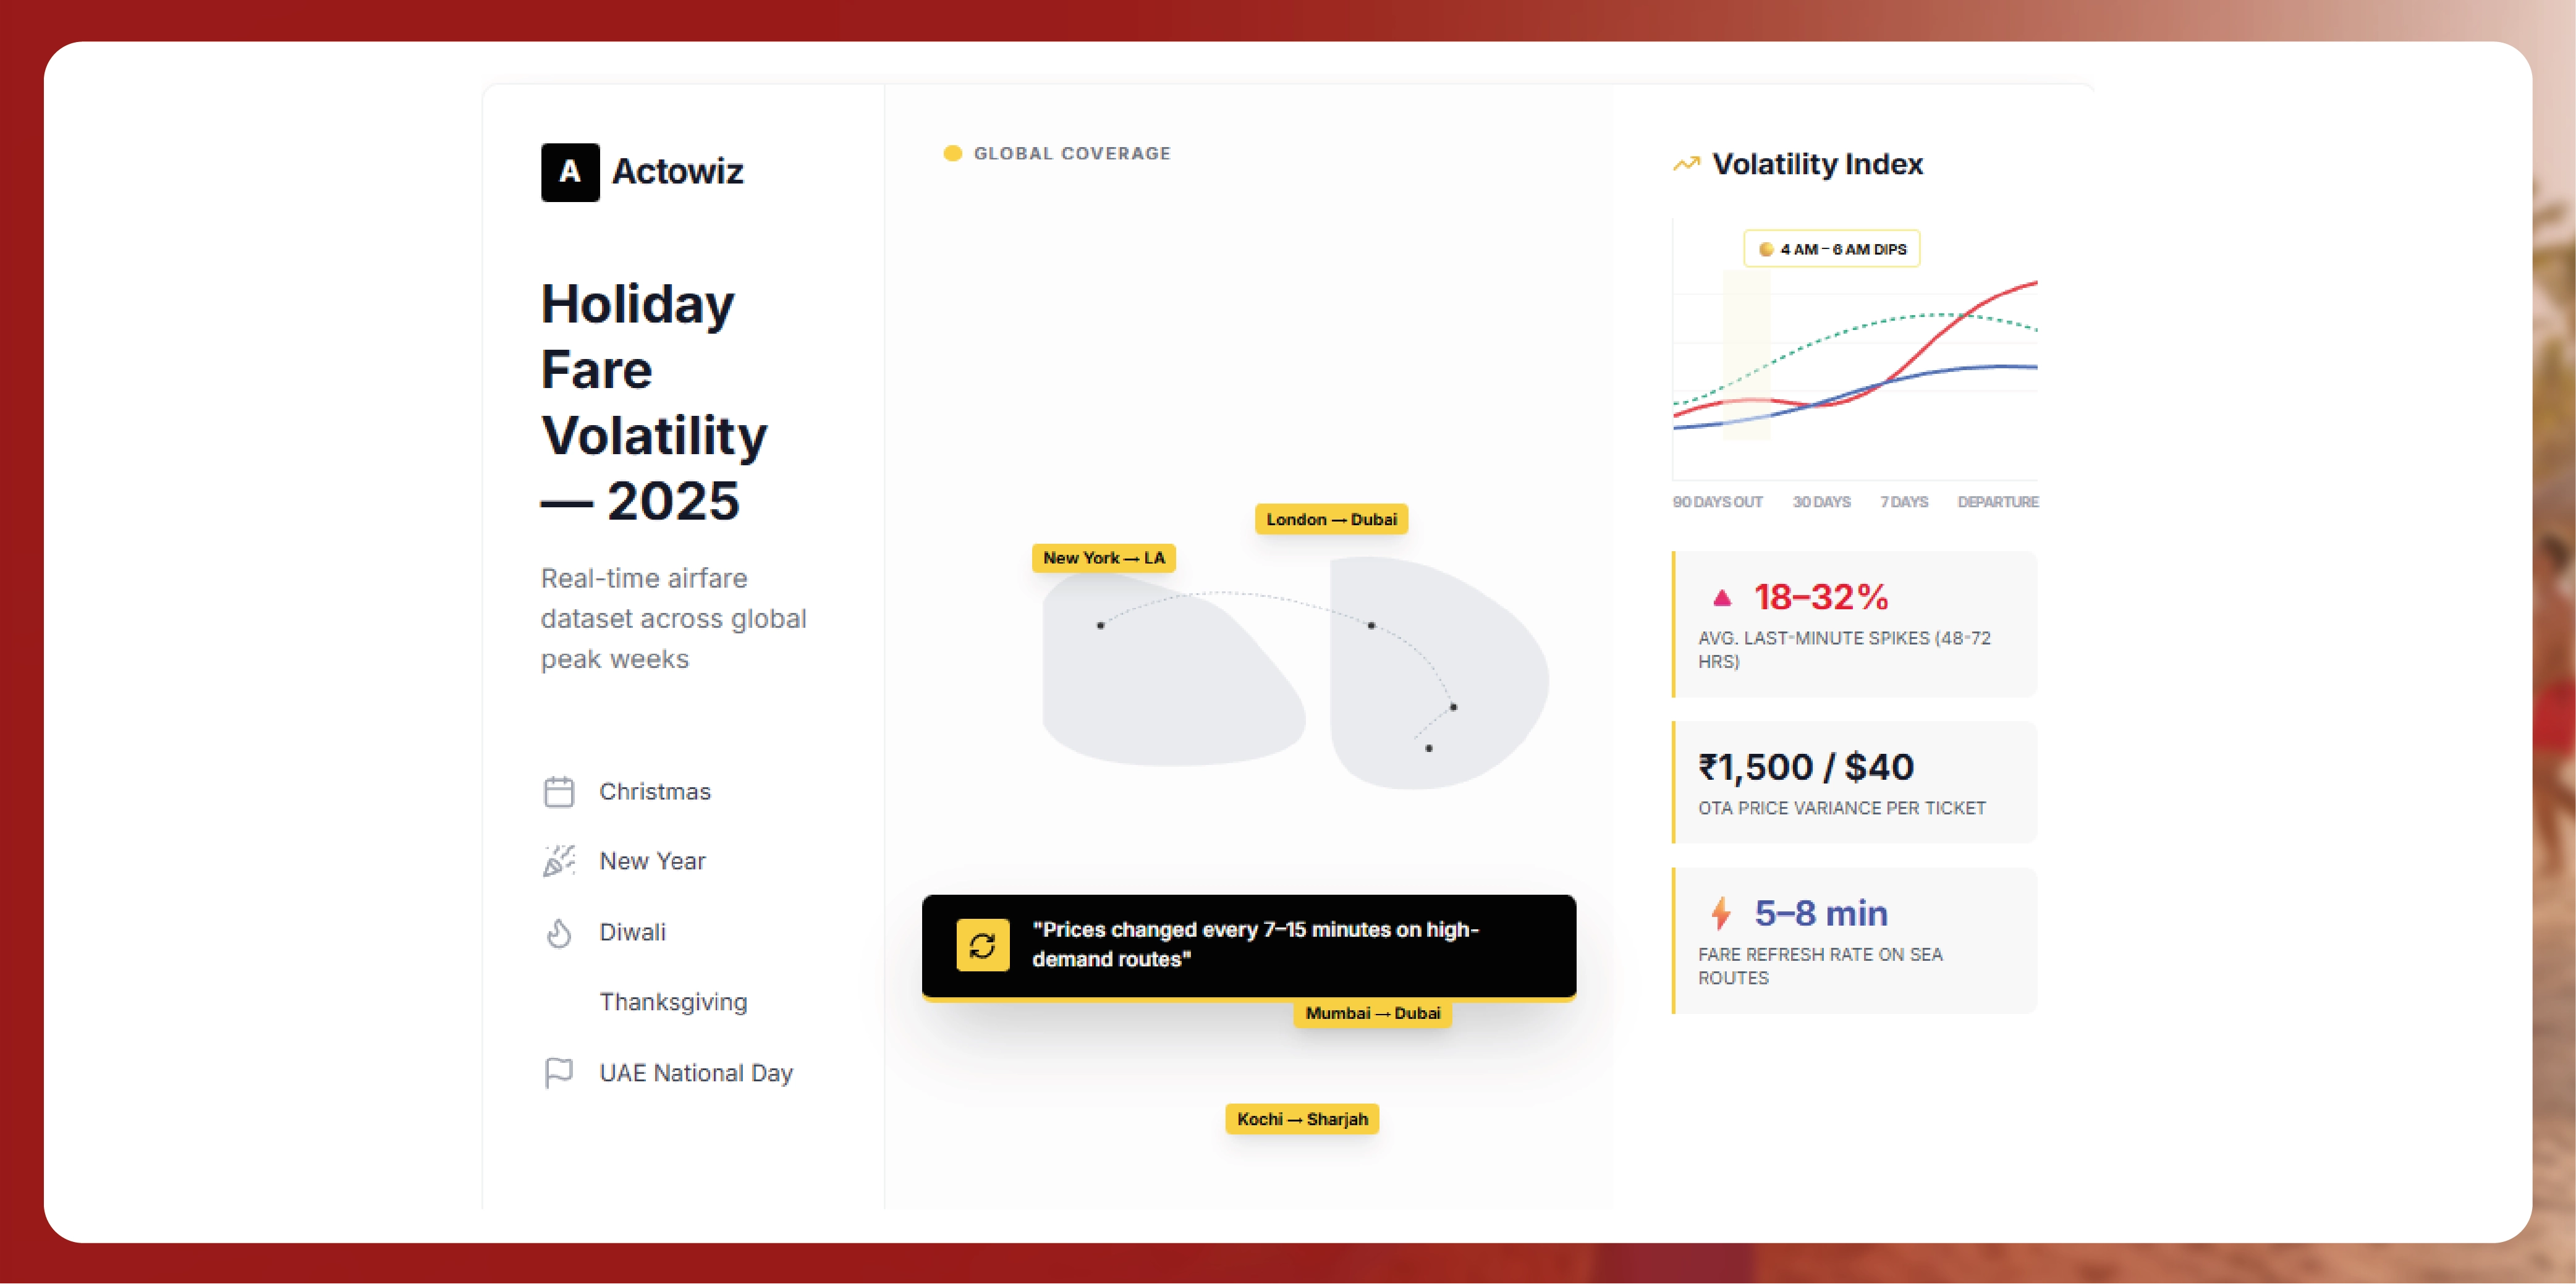
Our 2025 dataset covered peak travel weeks around Christmas, New Year, Diwali, Thanksgiving, and UAE National Day.
The findings reveal clear patterns:
1. Prices changed every 7–15 minutes on high-demand routes
Routes with the highest volatility:
- Mumbai → Dubai
- Delhi → Abu Dhabi
- Kochi → Sharjah
- New York → Los Angeles
- London → Dubai
Holiday season traffic forced airlines to push dynamic pricing rules aggressively.
2. Last-minute fare spikes averaged 18–32%
Passengers searching within 48–72 hours before departure saw the steepest increases.
Budget carriers showed the fastest spike patterns during the final 24 hours.
3. Early-morning dips outperform midnight searches
Across markets, the 4 AM – 6 AM window showed the highest rate of temporary dips.
4. OTA price differences reached up to ₹1,500 / $40 per ticket
Actowiz detected discrepancies between:
- Google Flights
- MakeMyTrip
- Skyscanner
- Emirates.com
- Cleartrip
- Kayak
These variations persist because OTAs use different caching and fare refresh cycles.
5. SEA routes (Singapore, Kuala Lumpur, Bangkok) showed the most mid-day volatility
Fares changed almost every 5–8 minutes during peak season.
Fare Trend Comparison on Multiple Routes
Why API-Based Monitoring Misses These Patterns
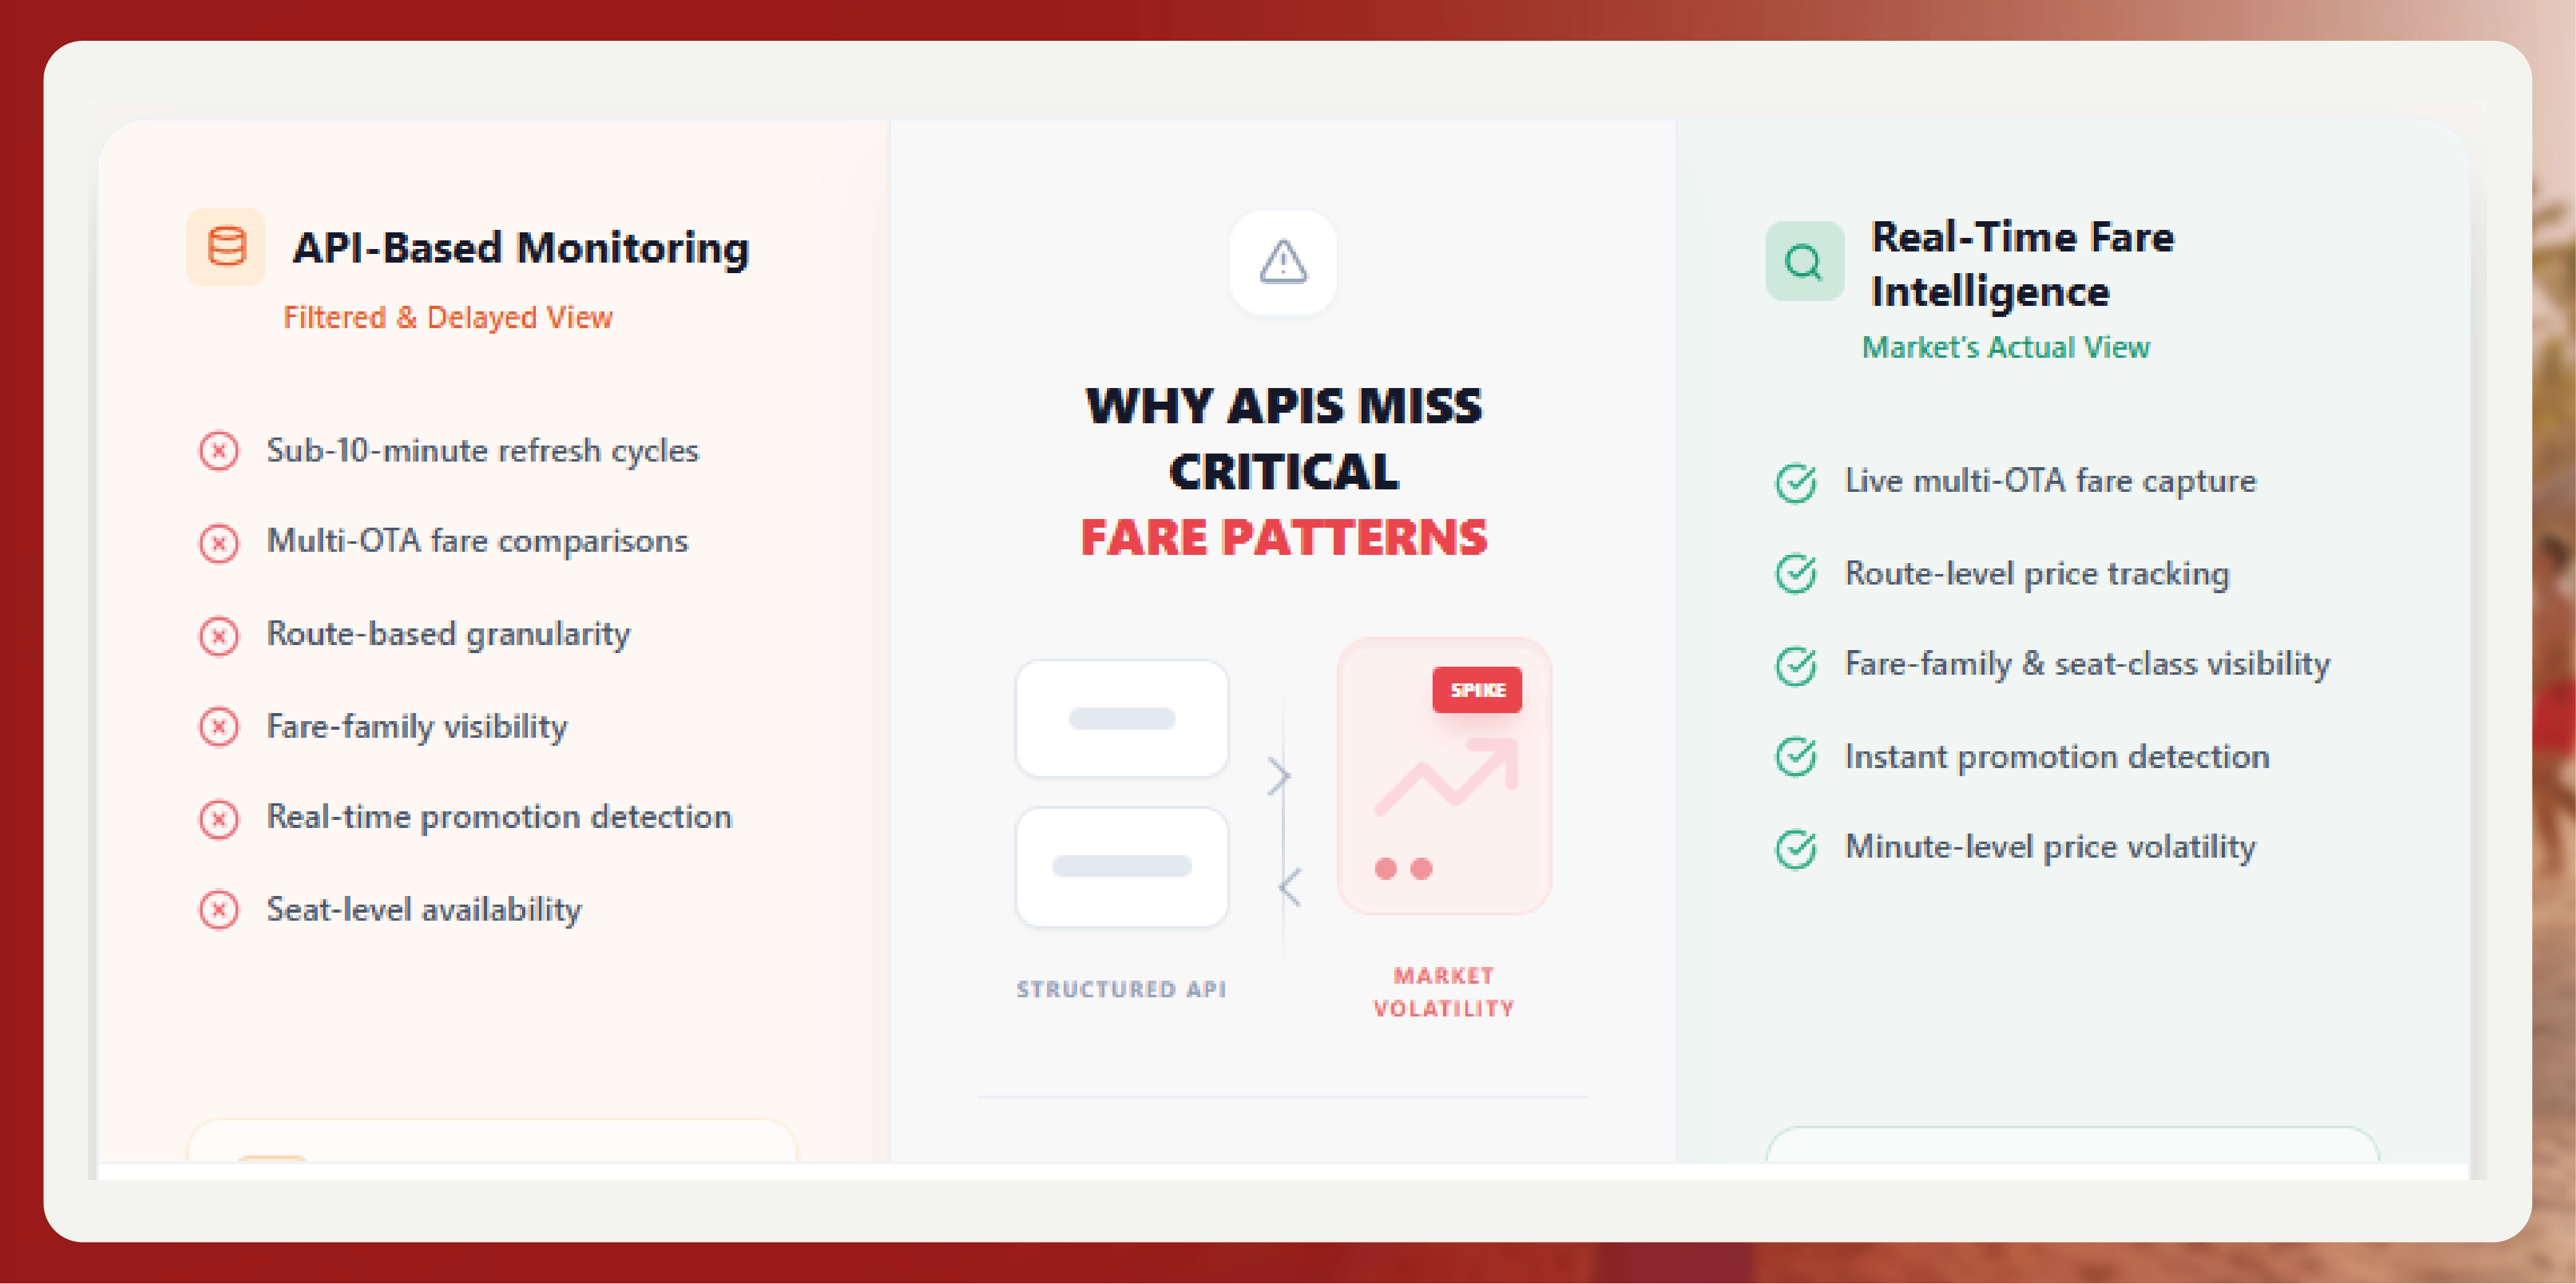
Most airline APIs cannot provide:
- Sub-10-minute refresh cycles
- Multi-OTA fare comparisons
- Route-based granularity
- Fare-family level visibility
- Real-time promotion detection
- Seat-level availability fluctuations
APIs give a filtered view. Real-time scraping gives the market’s actual view.
This is why Actowiz Solutions built a fare intelligence engine designed for volatility-heavy periods like the holiday season.
API vs Real-Time Data Comparison Diagrams
How Actowiz Captures Real-Time Fare Volatility
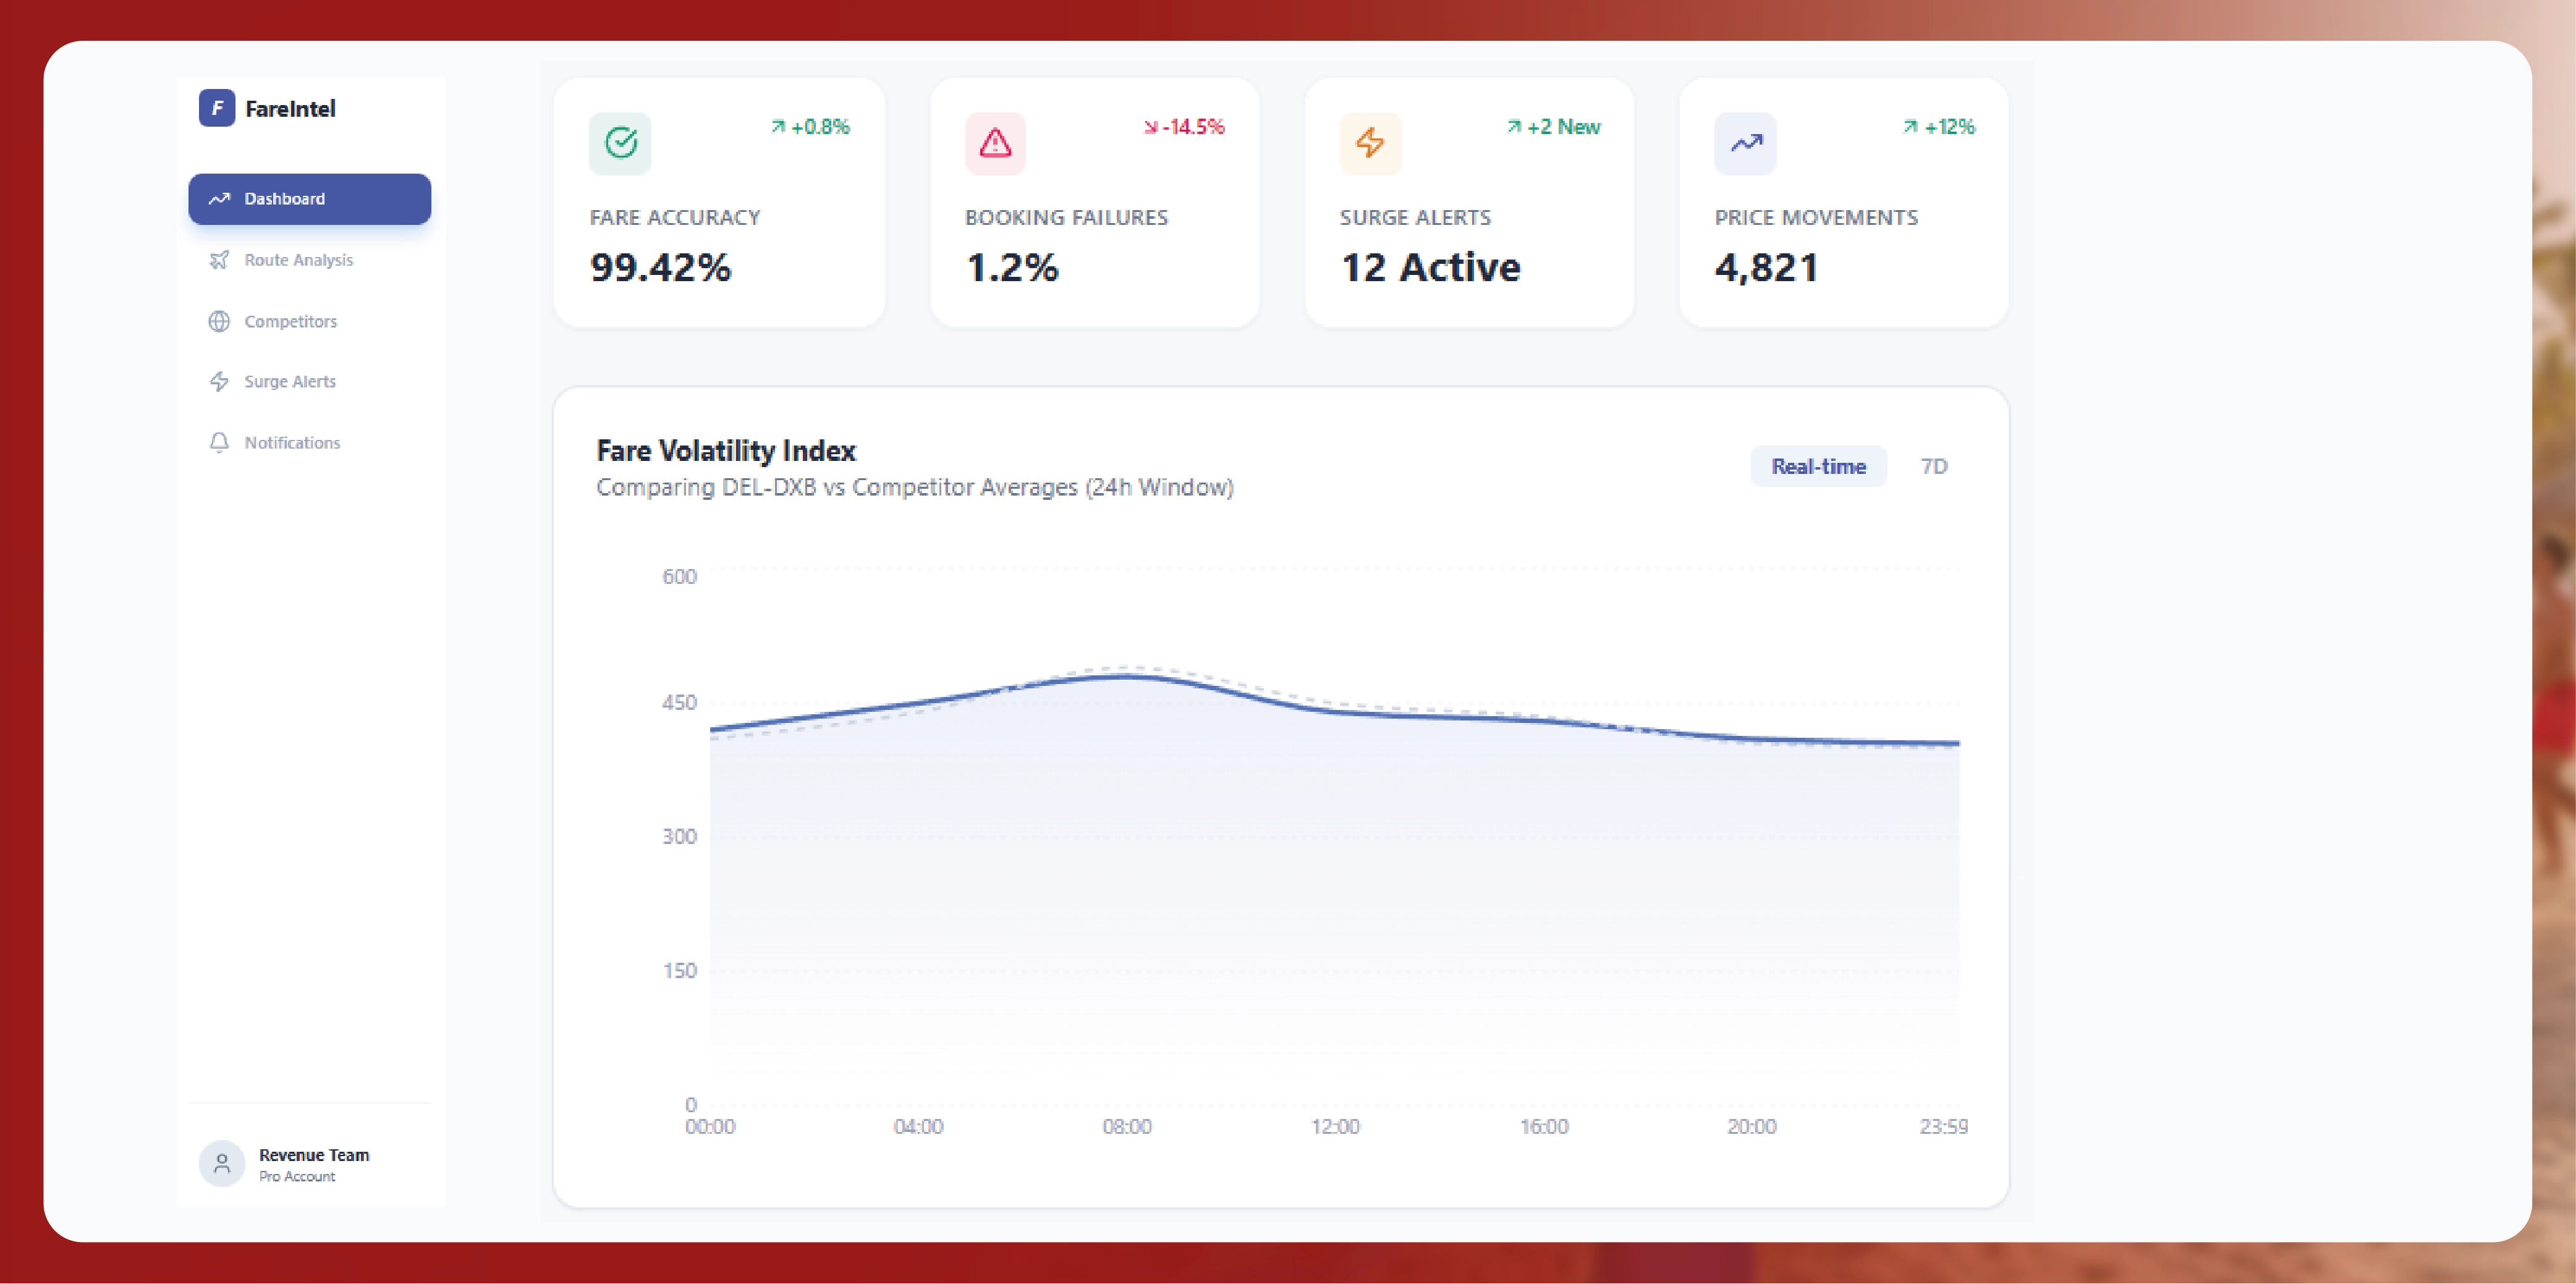
Our system is built for high-frequency fare intelligence.
- Continuous fare sampling
Across airlines & OTAs every 3–5 minutes. - Seat class mapping
Economy Lite, Saver, Flex, Business, Premium — all fare groups extracted. - Multi-source comparison
Direct airline websites + OTA aggregator platforms. - Time-series dataset creation
Every fare change logged with timestamp precision. - Surge and dip detection algorithms
Alerts sent when fares cross predefined thresholds. - Regional market analysis
India, UAE, SEA, USA, Europe.
Fare Intelligence Dashboard – Real-Time Alerts
What Travel Companies Can Do With This Data
1. Improve search accuracy for customers
Avoid stale fares and reduce booking failures.
2. Optimize holiday promotions
Know when competitors drop fares and react instantly.
3. Predict surge windows
Use historical volatility patterns for planning.
4. Offer better fare recommendations
Which hour of the day gives the lowest fares?
Which route is stabilizing?
Which carrier is aggressively discounting?
5. Increase conversion rates on OTAs
Live fare accuracy = fewer surprises at checkout.
OTA Fare Recommendations UI
Conclusion: Holiday Season Needs High-Frequency Fare Intelligence
Holiday travel doesn't wait.
Passengers book quickly, fares move rapidly, and carriers adjust aggressively.
Relying on airline APIs alone means missing most volatility spikes — and losing customers to more accurate competitors.
Actowiz Solutions provides OTAs, airlines, and travel platforms with:
Real-time fare tracking
Hourly and minute-level volatility insights
Multi-platform comparison
Full fare-family visibility
Airport and route-level intelligence
This is not just data — it's the competitive advantage travel companies need for 2025 and beyond.
You can also reach us for all your mobile app scraping, data collection, web scraping , and instant data scraper service requirements!
📩 Email Us:
✉️ [email protected]
📞 Call or WhatsApp:
📱 +1 (424) 377-7584
Source>> https://www.actowizsolutions.com/holiday-season-fare-volatility-real-time-dataset-study.php
#HolidayAirfareVolatilityStudy2025
#RealTimeHolidayAirfareVolatility
#HolidayFareVolatility
#RealTimeFareVolatility
#RealTimeDatasetStudy


Sign in to leave a comment.