Wool quality decisions depend on clear, consistent data. For growers, brokers and processors, few numbers matter more than fibre micron, its distribution and how that distribution influences processing yield and handling. IWTO-47 sets the common language for wool fibre diameter measurement, and the OFDA2000 is a proven tool that brings that language into real sampling environments on farms and in labs. This guide explains how IWTO-47 works in practice, what the OFDA2000 measures, how to prepare and sample wool correctly, and the checks that keep data repeatable across sites and seasons.
Why fibre diameter is the anchor metric
Fibre diameter is the headline driver of price for many wool categories, with finer microns generally commanding a premium because of comfort and fabric handle. Diameter variation within a lot also matters, since broad tails in a diameter distribution can lift prickle risk in fine apparel and affect evenness in spinning. When teams share data, they need one reference method that lets results travel from farm shed to auction catalogue to mill lab without confusion. That is where IWTO-47 provides the reference for wool fibre diameter measurement and related statistics, and where an instrument like the OFDA2000 enables rapid field and lab use grounded in that method.
What IWTO-47 covers
IWTO-47 is the internationally recognised method for determining mean fibre diameter and diameter distribution in wool. At its core, the method defines sampling, preparation, measurement and calculation steps so that results are comparable between laboratories. It covers items such as the conditioning of samples to standard temperature and humidity, the preparation of snippets or staples depending on the measurement approach, the calibration and verification routines for the instrument, and the statistical outputs to be reported, including mean fibre diameter, standard deviation, coefficient of variation and comfort factor estimates. By following IWTO-47, users reduce the risk that differences seen between bales or lots are an artefact of sampling or setup rather than a real difference in the fibre.
Where the OFDA2000 fits
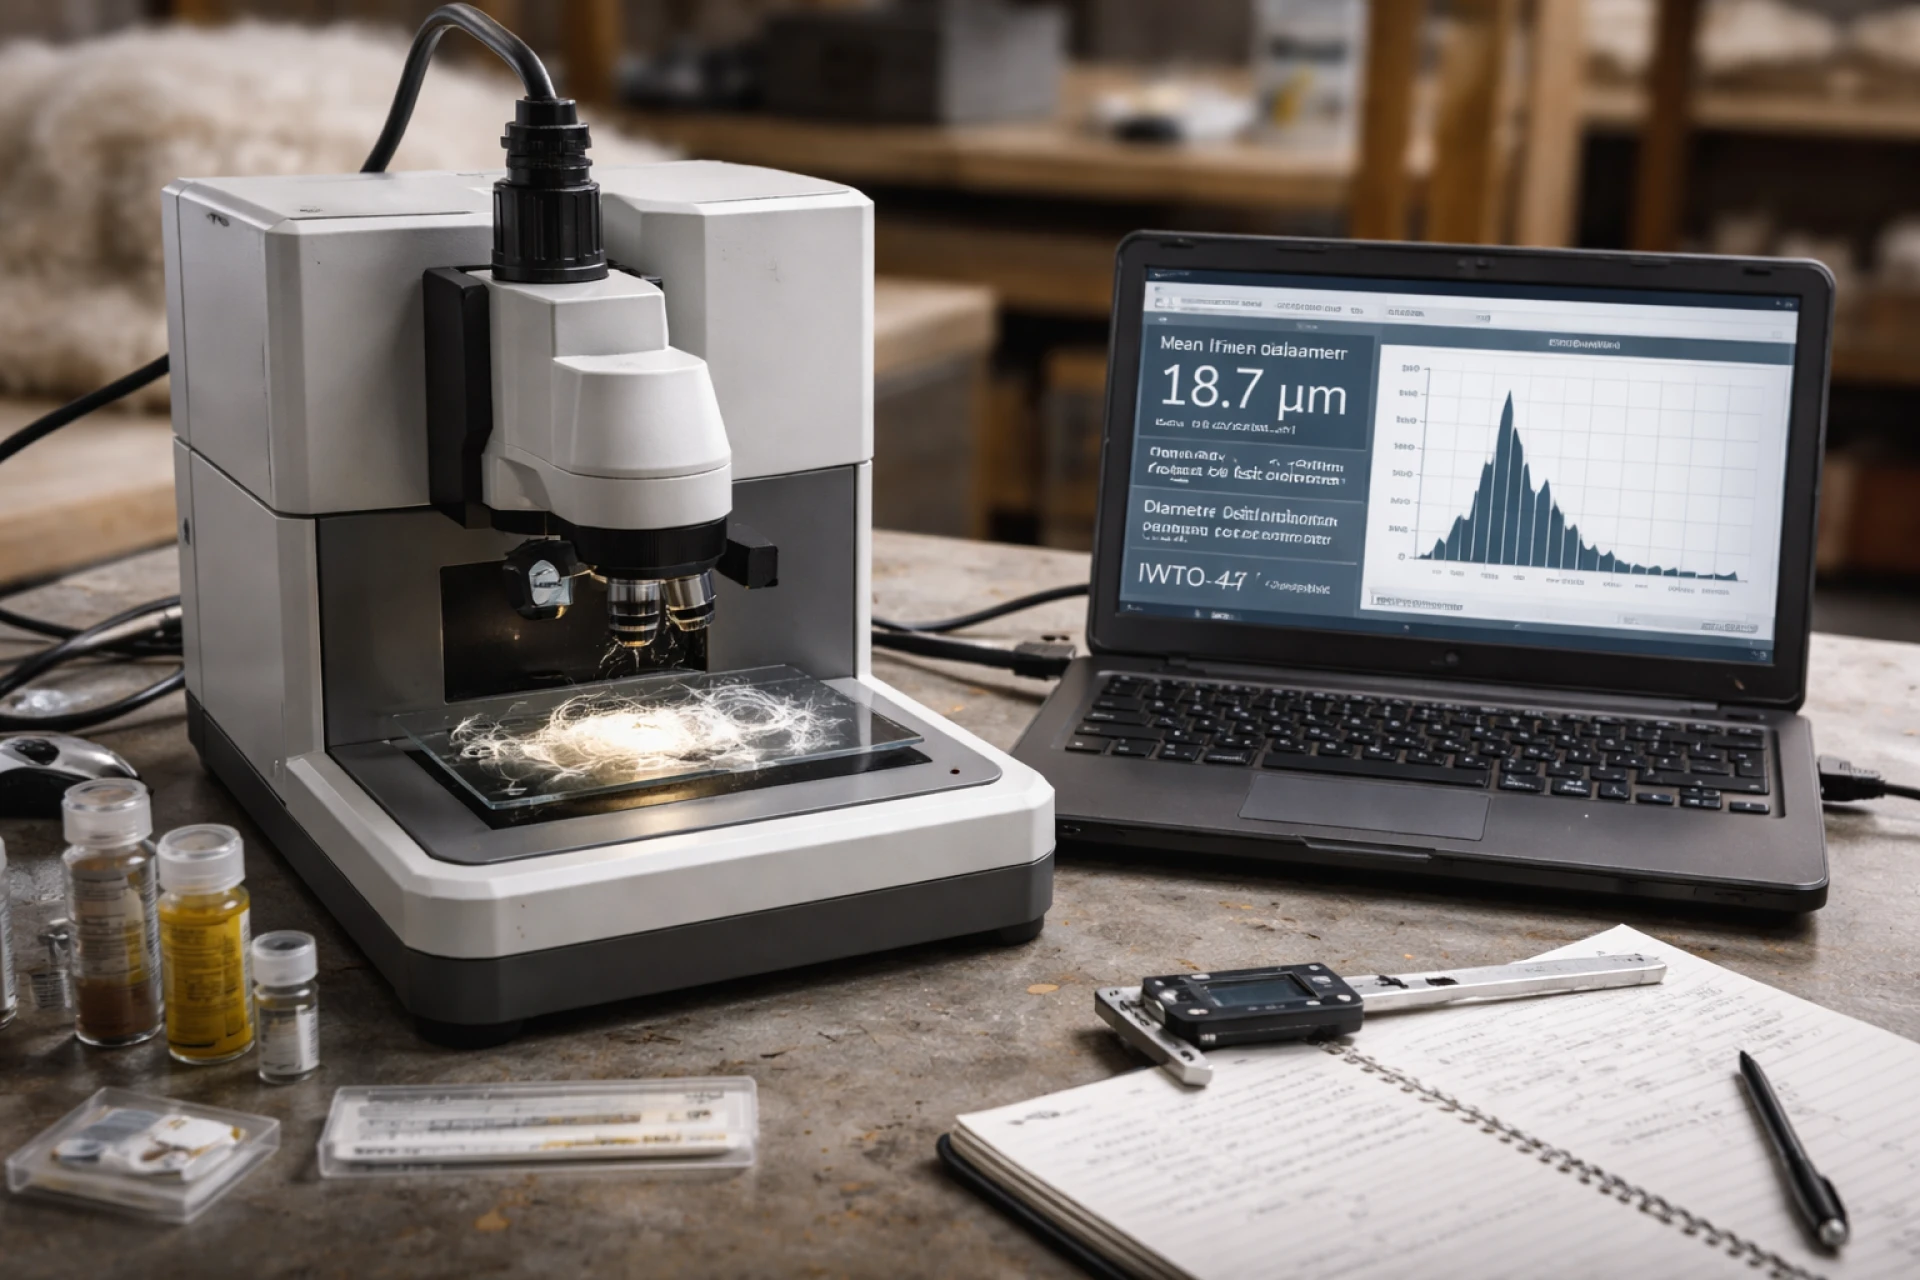
The OFDA2000 is a portable optical instrument designed for high throughput wool fibre diameter measurement in sheds, classing rooms and laboratories. It uses image based analysis to measure thousands of fibres from prepared snippets within minutes, reporting mean fibre diameter and the full distribution. Because it is designed to travel, it supports robust workflows where samples are collected and measured close to source, then validated against lab checks to maintain confidence. For teams that need fast feedback on farm or during lot building, the OFDA2000 shortens the loop between shearing and decision making while preserving alignment to IWTO-47 practice.
Sampling and preparation that protect data quality
A sound number starts with a sound sample. The following steps are widely used to align with IWTO-47 concepts while making the most of the OFDA2000 workflow.
- Define the unit you want to represent. Is it an individual sheep, a mob, a bale or a sale lot. Your sampling plan should reflect that unit so that averages and distributions are meaningful for the decisions you will make.
- Collect representative staples. Draw staples across the fleece, including mid side positions for animals or representative positions for bales. Avoid tips or heavily contaminated ends. Keep tools clean and label everything.
- Condition the wool where possible. Standard temperature and humidity help stabilise measurements. If field conditions vary widely, note them in your worksheet and maintain consistency within each sampling session.
- Prepare snippets for the OFDA2000. Cut small snippets from mid length regions of the staples. Mix the cut fibres gently to reduce bias. Avoid crushing. Place the fibres onto the sample slide as a thin, even layer without clumps.
- Apply repeatable slide loading technique. Even loading supports consistent focus and thresholding in image analysis. Train operators to follow a simple, written sequence so that person to person variation stays low.
- Document the chain. Link animal or bale IDs to slides, record time, operator and any unusual observations such as seed contamination. Documentation is the friend of traceability when results are compared later.
Measurement workflow with the OFDA2000
Once a slide is prepared, the OFDA2000 workflow is straightforward.
- Instrument warm up and checks. Allow the unit to reach stable operating temperature. Run a daily verification slide to confirm focus and scale. Record results in a log.
- Set measurement parameters. Confirm magnification, pixel scale and threshold values according to the instrument manual and your standard method. Save a named setup to prevent accidental changes.
- Acquire images and measure. The instrument captures images across the slide, identifies individual fibres and measures their diameters. Thousands of fibres are typically measured per sample.
- Review quality flags. Check image coverage, focus indicators and the proportion of rejected fibres. If quality flags trigger, reload the slide or prepare a new one.
- Export results. Save mean fibre diameter, standard deviation, coefficient of variation and the histogram. Attach metadata such as sample ID and operator.
Keeping alignment with IWTO-47
Field speed is valuable, yet alignment to IWTO-47 remains the guardrail for comparability.
- Calibration and verification. Use certified calibration artefacts at the intervals recommended by your quality system. Record calibrations, and compare verification slide results against control limits.
- Replicates and repeats. Measure at least two slides per sample, or split samples where practical, and confirm that replicate means fall within your defined repeatability band. Outliers should trigger a recheck of slide prep and focus.
- Control samples. Maintain a small set of stable control samples that you measure in each session. Trend their mean fibre diameter and variation in a control chart. Stability over time indicates that the system is in control.
- Cross checks with a lab. Periodically send duplicate samples to a reference laboratory that operates under IWTO-47. Compare means and distributions. If a bias emerges, adjust technique or calibration and document the change.
Understanding and using the distribution
Many decisions benefit from more than a single micron value. The OFDA2000 reports a full diameter distribution that helps users capture the character of a lot.
- Comfort factor. The proportion of fibres below a defined threshold, such as 30 microns for next to skin apparel, relates to prickle risk. A lot with the same mean but a tighter distribution can behave better in wear.
- Coefficient of variation. CV expresses spread relative to the mean. High CV may signal mixed sources or preparation issues that could show up as unevenness during spinning.
- Histogram shape. A long tail toward coarse fibres can affect handle and dye uptake. Operators can use the histogram to decide whether to subdivide a lot or to blend for a targeted outcome.
Practical tips that lift repeatability
- Consistent cutting. Use sharp, clean scissors to create clean fibre ends that the image analysis can detect reliably. Ragged ends can increase rejects.
- Slide discipline. Keep slides dust free. Store them in clean sleeves. Replace slides that show scratches.
- Operator rotation. If more than one operator prepares slides, rotate them through the same set of samples during training. Shared feedback tightens technique across the team.
- Data hygiene. Standardise filenames and fields in exports. Consistent naming reduces errors when aggregating results for reporting or sale documentation.
Interpreting numbers in real decisions
For on farm classing, a quick OFDA2000 read can validate whether a mob fits a declared micron bracket before building lots. In a broker setting, measuring grab samples from bales can support more precise lotting decisions and help explain any outliers seen in previous seasons. In a mill, repeat measurements during blending can track whether a target mean and spread remain within tolerance as mix ratios change. Across these contexts, the combination of IWTO-47 aligned practice and the throughput of the OFDA2000 keeps decisions grounded in data rather than guesswork.
Common questions and clear answers
How many fibres should I measure. Thousands per slide is typical, which provides stable estimates of mean and spread. Replicate slides confirm that sampling and loading variation remain low.
What if my field humidity is far from standard. Conditioning to standard settings is preferred when available. If not possible, maintain consistent conditions within a session and document them, then use control samples to detect drift between sessions.
Can I compare my on farm numbers with a certificate from a testing house. Yes, if both are aligned to IWTO-47 practice and you maintain calibration and control routines. Expect small differences due to sampling and preparation, and treat regular cross checks as part of your quality plan.
Does crimp or curvature affect diameter measurement. Curvature does not change the fibre’s true diameter, yet very curly fibres may lie unevenly on a slide if overloaded. Thin, even loading and good focus help ensure reliable identification of fibre edges.
How often should I recalibrate. Follow your quality system. A practical pattern is to verify each day of use, calibrate at defined intervals, and recalibrate whenever control samples indicate a sustained shift.
Bringing it all together
IWTO-47 gives the shared rules for wool fibre diameter measurement. The OFDA2000 provides speed and consistency that suit real world sampling across farms, classing rooms and labs. When teams sample carefully, prepare clean slides, run verification checks and use distributions rather than single numbers alone, they gain a clearer picture of their wool and make better decisions from shearing through to spinning. The result is fewer surprises, steadier quality and more confidence from sale to finished fabric.


Sign in to leave a comment.