The "Metaverse Market in Finance is set to grow by USD 107.06 billion and the growth momentum will be accelerating at a CAGR of 21.33% during the forecast period. The market is driven by the integration of VR and AR platforms, AI-powered blockchain technology, and the rising adoption of cryptocurrency. Businesses operating in the finance sector are expanding their presence in the metaverse to offer better services to their customers. Highlights on the yearly growth variance and the Y-O-Y growth rate for forecast period (2023-2027) and historic period (2017 to 2021) - Download a Sample Report
Market Dynamics:
Driver – The market is driven by the integration of VR and AR platforms. Businesses operating in the finance sector are expanding their presence in the metaverse to offer better services to their customers. For instance, the incorporation of VR glasses allows customers to handle all their banking and financial activities from anywhere and in a far more immersive way. Similarly, the use of AR allows customers to track and visualize financial markets in more depth through holographic representation, 3D figures, and smart heat maps. The incorporation of such digital technologies is helping banks to manage digital transactions more efficiently. All these developments are expected to foster the growth of the market during the forecast period.Challenge – Privacy and security concerns over the metaverse are challenging the growth of the market. Data privacy and security of sensitive information have always been a major concerns for users in the metaverse. Metaverse collects a lot of information from the user's social networking accounts. The security of such information can be compromised if hackers gain access to the user's devices. Moreover, devices such as smart glasses, VR headsets, and others violate privacy by automatically screening and processing the user's environment. Many such concerns are reducing the growth potential in the market.Discover other factors impacting the growth of the market with historic and forecast, 2017 to 2021 and 2023 to 2027, USD Billion - Download a Sample Report
Metaverse In Finance Market Scope
Report Coverage
Details
Base year
2022
Historic period
2017-2021
Forecast period
2023-2027
Growth momentum & CAGR
Accelerate at a CAGR of 21.33%
Market growth 2023-2027
USD 107.06 billion
Market structure
Concentrated
YoY growth 2022-2023 (%)
20.59
Regional analysis
North America, Europe, APAC, South America, and Middle East and Africa
Performing market contribution
APAC at 32%
Key countries
US, Canada, China, Germany, Mexico, Italy, Spain, Japan, Australia, India, South Korea and UK
Competitive landscape
Leading Vendors, Market Positioning of Vendors, Competitive Strategies, and Industry Risks
Key companies profiled
Bank of America Corp., BNP Paribas SA, HSBC Holdings Plc, IBK Industrial Bank of Korea, JPMorgan Chase and Co., KB Financial Group Inc., Mogo Inc., National Bank of Kuwait S.A.K.P, NH Investment and Securities Co. Ltd., and Shinhan Financial Group Co. Ltd.
Market dynamics
Parent market analysis, market growth inducers and obstacles, fast-growing and slow-growing segment analysis, COVID-19 impact and recovery analysis and future consumer dynamics, and market condition analysis for the forecast period.
Customization purview
If our report has not included the data that you are looking for, you can reach out to our analysts and get segments customized.
What`s New for 2023?
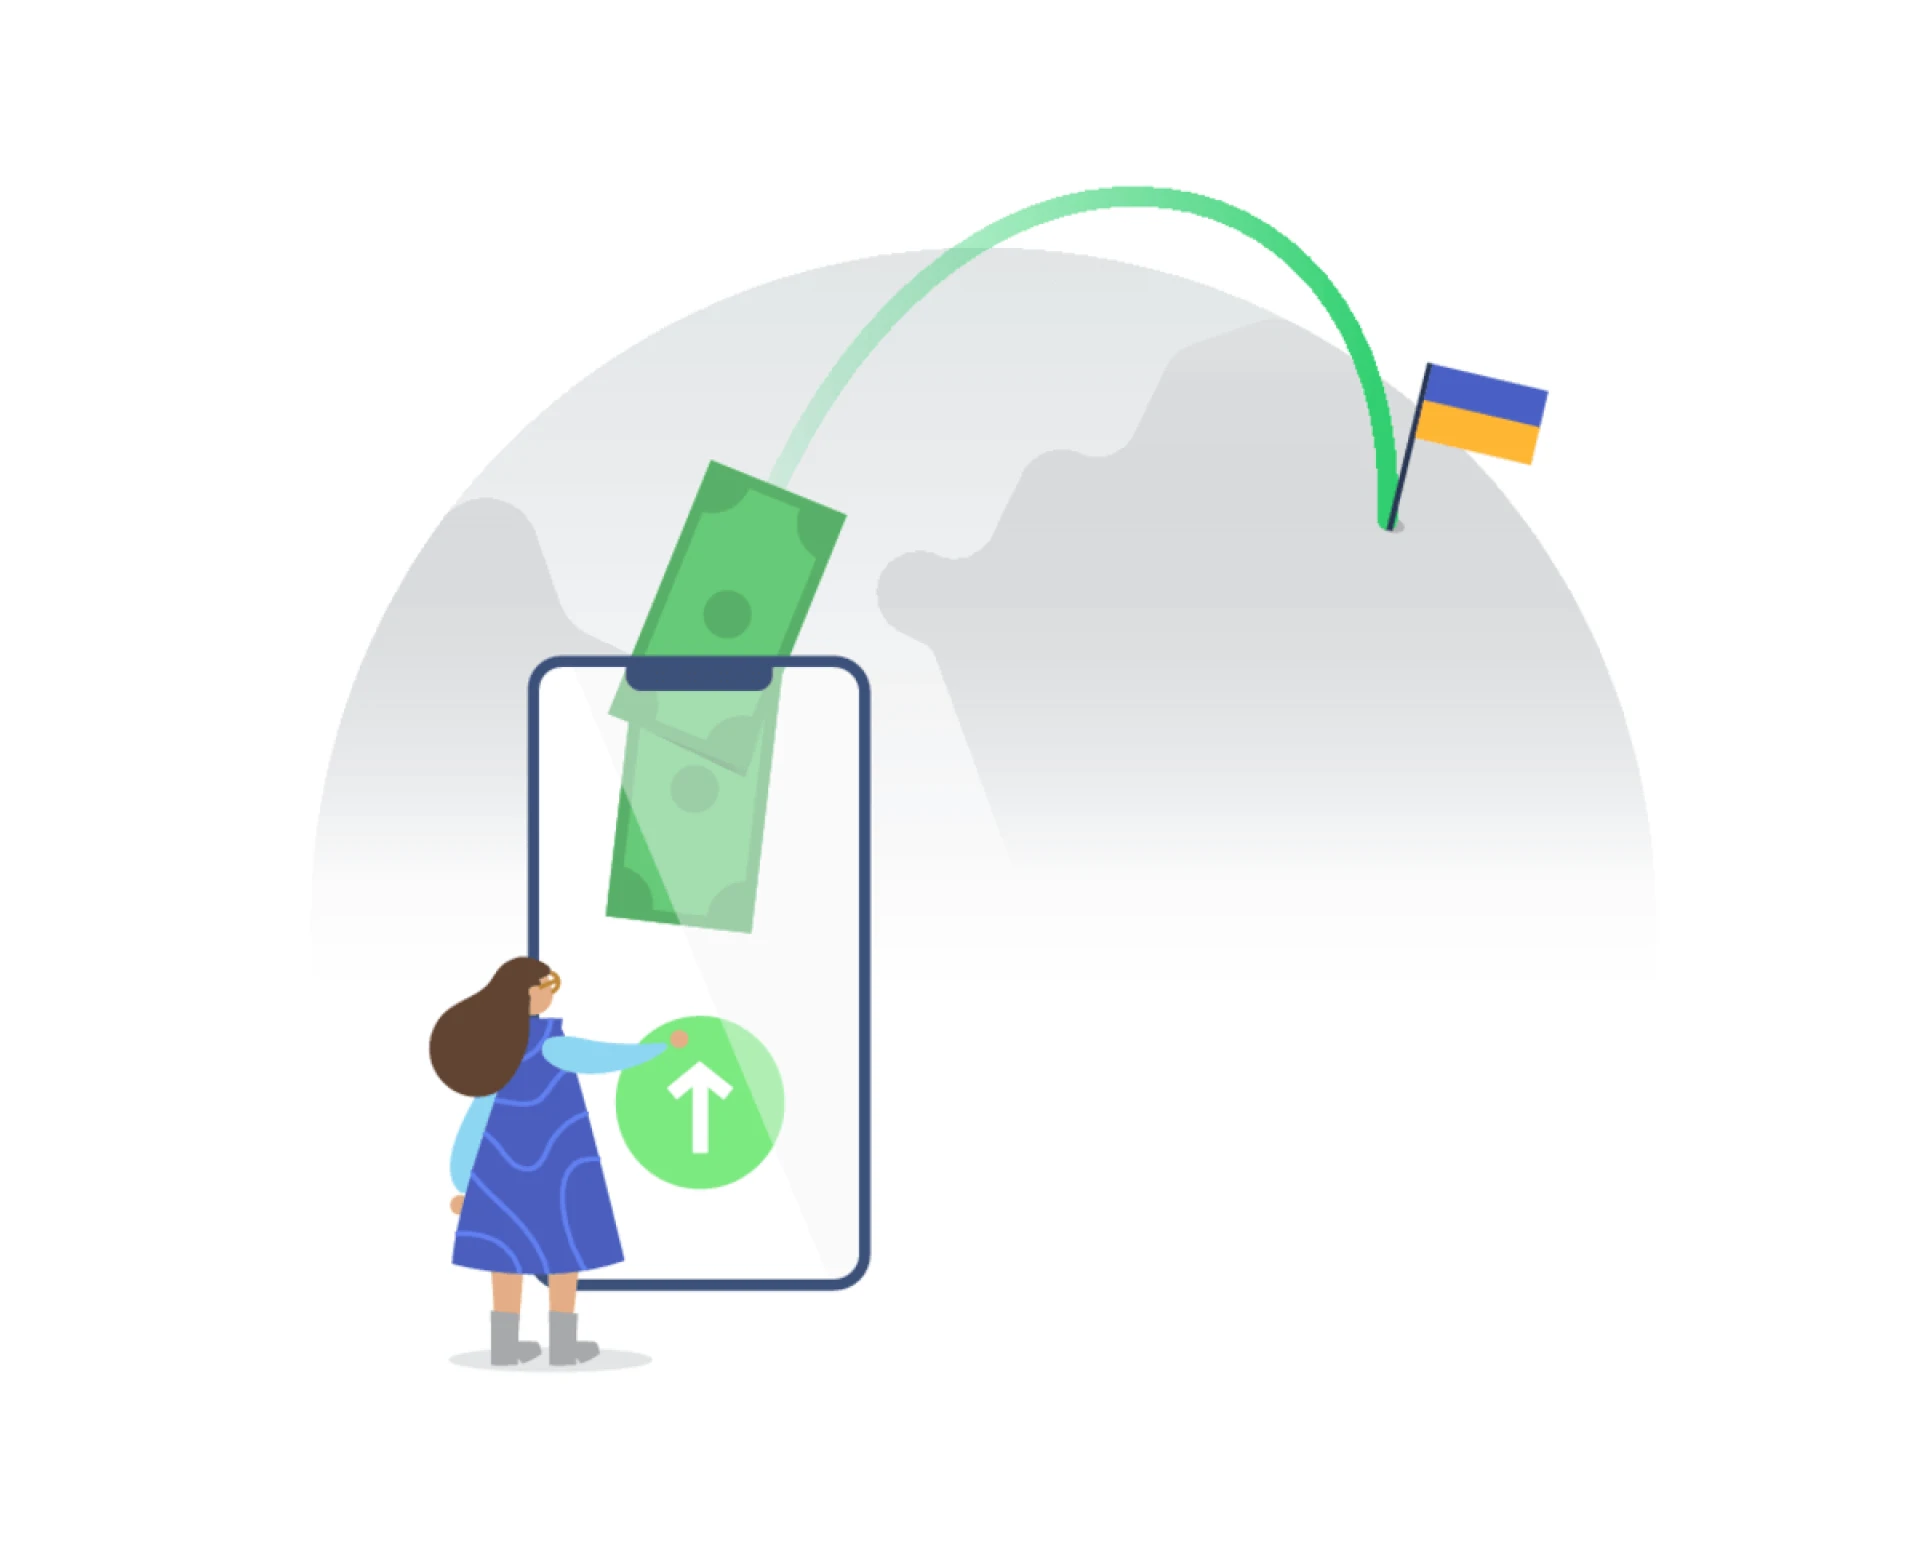
Special coverage on the Russia-Ukraine war; global inflation; recovery analysis from COVID-19; supply chain disruptions, global trade tensions; and risk of recessionGlobal competitiveness and key competitor positionsMarket presence across multiple geographical footprints - Strong/Active/Niche/TrivialKey Companies Covered:
Technavio provides a detailed analysis of the competitive landscape and information on major vendors including:
Bank of America Corp. - The company offers metaverse in finance through VR Training programs.BNP Paribas SA - The company offers metaverse in finance through W.I.R.E.D. (Wearable Immersive Real Estate Dataroom).HSBC Holdings Plc - The company offers metaverse in finance with the use of augmented reality, virtual reality, and extended reality.IBK Industrial Bank of Korea - The company offers metaverse in finance through the platform, Cyworld.Market Segmentation:
The global metaverse market in finance is segmented by component (hardware and software), end-user (brokerage firms, investment banks, commercial banks, and others), and geography (APAC, North America, Europe, Middle East and Africa, and South America).
By component, the market growth will be significant in the hardware segment. Similarly, APAC will account for 32% of the market growth during the forecast period.
Why Buy?
Add credibility to strategyAnalyzes competitor's offeringsGet a holistic view of the marketGrow your profit margin with Technavio – Buy the Report!
Related Reports:
The metaverse in entertainment market is estimated to grow at a CAGR of 9.07% between 2022 and 2027. The size of the market is forecast to increase by USD 33,323.31 million. The growing adoption of AR/VR gaming by individuals is notably driving the market growth, although factors such as privacy and security concerns over the metaverse may impede the market growth.The metaverse market is estimated to grow at a CAGR of 40.06% between 2022 and 2027. The size of the market is forecast to increase by USD 1,152.35 billion. The growing smartphone penetration and use of 5G are notably driving the market growth, although factors such as privacy and security concerns over the metaverse may impede the market growth.Gain instant access to 17,000+ market research reports.
Technavio's SUBSCRIPTION platform
Table Of Contents:
1 Executive Summary
1.1 Market overviewExhibit 01: Executive Summary – Chart on Market OverviewExhibit 02: Executive Summary – Data Table on Market OverviewExhibit 03: Executive Summary – Chart on Global Market CharacteristicsExhibit 04: Executive Summary – Chart on Market by GeographyExhibit 05: Executive Summary – Chart on Market Segmentation by ComponentExhibit 06: Executive Summary – Chart on Market Segmentation by End-userExhibit 07: Executive Summary – Chart on Incremental GrowthExhibit 08: Executive Summary – Data Table on Incremental GrowthExhibit 09: Executive Summary – Chart on Vendor Market Positioning2 Market Landscape
2.1 Market ecosystemExhibit 10: Parent marketExhibit 11: Market Characteristics3 Market Sizing
3.1 Market definitionExhibit 12: Offerings of vendors included in the market definition3.2 Market segment analysisExhibit 13: Market segments3.3 Market size 20223.4 Market outlook: Forecast for 2022-2027Exhibit 14: Chart on Global - Market size and forecast 2022-2027 ($ billion)Exhibit 15: Data Table on Global - Market size and forecast 2022-2027 ($ billion)Exhibit 16: Chart on Global Market: Year-over-year growth 2022-2027 (%)Exhibit 17: Data Table on Global Market: Year-over-year growth 2022-2027 (%)4 Historic Market Size
4.1 Global metaverse market in finance 2017 - 2021Exhibit 18: Historic Market Size – Data Table on Global metaverse market in finance 2017 - 2021 ($ billion)4.2 Component Segment Analysis 2017 - 2021Exhibit 19: Historic Market Size – Component Segment 2017 - 2021 ($ billion)4.3 End-user Segment Analysis 2017 - 2021Exhibit 20: Historic Market Size – End-user Segment 2017 - 2021 ($ billion)4.4 Geography Segment Analysis 2017 - 2021Exhibit 21: Historic Market Size – Geography Segment 2017 - 2021 ($ billion)4.5 Country Segment Analysis 2017 - 2021Exhibit 22: Historic Market Size – Country Segment 2017 - 2021 ($ billion)5 Five Forces Analysis
5.1 Five forces summaryExhibit 23: Five forces analysis - Comparison between 2022 and 20275.2 Bargaining power of buyersExhibit 24: Chart on Bargaining power of buyers – Impact of key factors 2022 and 20275.3 Bargaining power of suppliersExhibit 25: Bargaining power of suppliers – Impact of key factors in 2022 and 20275.4 Threat of new entrantsExhibit 26: Threat of new entrants – Impact of key factors in 2022 and 20275.5 Threat of substitutesExhibit 27: Threat of substitutes – Impact of key factors in 2022 and 20275.6 Threat of rivalryExhibit 28: Threat of rivalry – Impact of key factors in 2022 and 20275.7 Market conditionExhibit 29: Chart on Market condition - Five forces 2022 and 20276 Market Segmentation by Component
6.1 Market segmentsExhibit 30: Chart on Component - Market share 2022-2027 (%)Exhibit 31: Data Table on Component - Market share 2022-2027 (%)6.2 Comparison by ComponentExhibit 32: Chart on Comparison by ComponentExhibit 33: Data Table on Comparison by Component6.3 Hardware - Market size and forecast 2022-2027Exhibit 34: Chart on Hardware - Market size and forecast 2022-2027 ($ billion)Exhibit 35: Data Table on Hardware - Market size and forecast 2022-2027 ($ billion)Exhibit 36: Chart on Hardware - Year-over-year growth 2022-2027 (%)Exhibit 37: Data Table on Hardware - Year-over-year growth 2022-2027 (%)6.4 Software - Market size and forecast 2022-2027Exhibit 38: Chart on Software - Market size and forecast 2022-2027 ($ billion)Exhibit 39: Data Table on Software - Market size and forecast 2022-2027 ($ billion)Exhibit 40: Chart on Software - Year-over-year growth 2022-2027 (%)Exhibit 41: Data Table on Software - Year-over-year growth 2022-2027 (%)6.5 Market opportunity by ComponentExhibit 42: Market opportunity by Component ($ billion)7 Market Segmentation by End-user
7.1 Market segmentsExhibit 43: Chart on End-user - Market share 2022-2027 (%)Exhibit 44: Data Table on End-user - Market share 2022-2027 (%)7.2 Comparison by End-userExhibit 45: Chart on Comparison by End-userExhibit 46: Data Table on Comparison by End-user7.3 Brokerage firms - Market size and forecast 2022-2027Exhibit 47: Chart on Brokerage firms - Market size and forecast 2022-2027 ($ billion)Exhibit 48: Data Table on Brokerage firms - Market size and forecast 2022-2027 ($ billion)Exhibit 49: Chart on Brokerage firms - Year-over-year growth 2022-2027 (%)Exhibit 50: Data Table on Brokerage firms - Year-over-year growth 2022-2027 (%)7.4 Investment banks - Market size and forecast 2022-2027Exhibit 51: Chart on Investment banks - Market size and forecast 2022-2027 ($ billion)Exhibit 52: Data Table on Investment banks - Market size and forecast 2022-2027 ($ billion)Exhibit 53: Chart on Investment banks - Year-over-year growth 2022-2027 (%)Exhibit 54: Data Table on Investment banks - Year-over-year growth 2022-2027 (%)7.5 Commercial banks - Market size and forecast 2022-2027Exhibit 55: Chart on Commercial banks - Market size and forecast 2022-2027 ($ billion)Exhibit 56: Data Table on Commercial banks - Market size and forecast 2022-2027 ($ billion)Exhibit 57: Chart on Commercial banks - Year-over-year growth 2022-2027 (%)Exhibit 58: Data Table on Commercial banks - Year-over-year growth 2022-2027 (%)7.6 Others - Market size and forecast 2022-2027Exhibit 59: Chart on Others - Market size and forecast 2022-2027 ($ billion)Exhibit 60: Data Table on Others - Market size and forecast 2022-2027 ($ billion)Exhibit 61: Chart on Others - Year-over-year growth 2022-2027 (%)Exhibit 62: Data Table on Others - Year-over-year growth 2022-2027 (%)7.7 Market opportunity by End-userExhibit 63: Market opportunity by End-user ($ billion)8 Customer Landscape
8.1 Customer landscape overviewExhibit 64: Analysis of price sensitivity, lifecycle, customer purchase basket, adoption rates, and purchase criteria9 Geographic Landscape
9.1 Geographic segmentationExhibit 65: Chart on Market share by geography 2022-2027 (%)Exhibit 66: Data Table on Market share by geography 2022-2027 (%)9.2 Geographic comparisonExhibit 67: Chart on Geographic comparisonExhibit 68: Data Table on Geographic comparison9.3 North America - Market size and forecast 2022-2027Exhibit 69: Chart on North America - Market size and forecast 2022-2027 ($ billion)Exhibit 70: Data Table on North America - Market size and forecast 2022-2027 ($ billion)Exhibit 71: Chart on North America - Year-over-year growth 2022-2027 (%)Exhibit 72: Data Table on North America - Year-over-year growth 2022-2027 (%)9.4 Europe - Market size and forecast 2022-2027Exhibit 73: Chart on Europe - Market size and forecast 2022-2027 ($ billion)Exhibit 74: Data Table on Europe - Market size and forecast 2022-2027 ($ billion)Exhibit 75: Chart on Europe - Year-over-year growth 2022-2027 (%)Exhibit 76: Data Table on Europe - Year-over-year growth 2022-2027 (%)9.5 APAC - Market size and forecast 2022-2027Exhibit 77: Chart on APAC - Market size and forecast 2022-2027 ($ billion)Exhibit 78: Data Table on APAC - Market size and forecast 2022-2027 ($ billion)Exhibit 79: Chart on APAC - Year-over-year growth 2022-2027 (%)Exhibit 80: Data Table on APAC - Year-over-year growth 2022-2027 (%)9.6 South America - Market size and forecast 2022-2027Exhibit 81: Chart on South America - Market size and forecast 2022-2027 ($ billion)Exhibit 82: Data Table on South America - Market size and forecast 2022-2027 ($ billion)Exhibit 83: Chart on South America - Year-over-year growth 2022-2027 (%)Exhibit 84: Data Table on South America - Year-over-year growth 2022-2027 (%)9.7 Middle East and Africa - Market size and forecast 2022-2027Exhibit 85: Chart on Middle East and Africa - Market size and forecast 2022-2027 ($ billion)Exhibit 86: Data Table on Middle East and Africa - Market size and forecast 2022-2027 ($ billion)Exhibit 87: Chart on Middle East and Africa - Year-over-year growth 2022-2027 (%)Exhibit 88: Data Table on Middle East and Africa - Year-over-year growth 2022-2027 (%)9.8 US - Market size and forecast 2022-2027Exhibit 89: Chart on US - Market size and forecast 2022-2027 ($ billion)Exhibit 90: Data Table on US - Market size and forecast 2022-2027 ($ billion)Exhibit 91: Chart on US - Year-over-year growth 2022-2027 (%)Exhibit 92: Data Table on US - Year-over-year growth 2022-2027 (%)9.9 China - Market size and forecast 2022-2027Exhibit 93: Chart on China - Market size and forecast 2022-2027 ($ billion)Exhibit 94: Data Table on China - Market size and forecast 2022-2027 ($ billion)Exhibit 95: Chart on China - Year-over-year growth 2022-2027 (%)Exhibit 96: Data Table on China - Year-over-year growth 2022-2027 (%)9.10 Germany - Market size and forecast 2022-2027Exhibit 97: Chart on Germany - Market size and forecast 2022-2027 ($ billion)Exhibit 98: Data Table on Germany - Market size and forecast 2022-2027 ($ billion)Exhibit 99: Chart on Germany - Year-over-year growth 2022-2027 (%)Exhibit 100: Data Table on Germany - Year-over-year growth 2022-2027 (%)9.11 UK - Market size and forecast 2022-2027Exhibit 101: Chart on UK - Market size and forecast 2022-2027 ($ billion)Exhibit 102: Data Table on UK - Market size and forecast 2022-2027 ($ billion)Exhibit 103: Chart on UK - Year-over-year growth 2022-2027 (%)Exhibit 104: Data Table on UK - Year-over-year growth 2022-2027 (%)9.12 Canada - Market size and forecast 2022-2027Exhibit 105: Chart on Canada - Market size and forecast 2022-2027 ($ billion)Exhibit 106: Data Table on Canada - Market size and forecast 2022-2027 ($ billion)Exhibit 107: Chart on Canada - Year-over-year growth 2022-2027 (%)Exhibit 108: Data Table on Canada - Year-over-year growth 2022-2027 (%)9.13 Market opportunity by geographyExhibit 109: Market opportunity by geography ($ billion)10 Drivers, Challenges, and Trends
10.1 Market drivers10.2 Market challenges10.3 Impact of drivers and challengesExhibit 110: Impact of drivers and challenges in 2022 and 202710.4 Market trends11 Vendor Landscape
11.1 Overview11.2 Vendor landscapeExhibit 111: Overview on Criticality of inputs and Factors of differentiation11.3 Landscape disruptionExhibit 112: Overview on factors of disruption11.4 Industry risksExhibit 113: Impact of key risks on business12 Vendor Analysis
12.1 Vendors coveredExhibit 114: Vendors covered12.2 Market positioning of vendorsExhibit 115: Matrix on vendor position and classification12.3 Bank of America Corp.Exhibit 116: Bank of America Corp. - OverviewExhibit 117: Bank of America Corp. - Business segmentsExhibit 118: Bank of America Corp. - Key newsExhibit 119: Bank of America Corp. - Key offeringsExhibit 120: Bank of America Corp. - Segment focus12.4 BNP Paribas SAExhibit 121: BNP Paribas SA - OverviewExhibit 122: BNP Paribas SA - Business segmentsExhibit 123: BNP Paribas SA - Key offeringsExhibit 124: BNP Paribas SA - Segment focus12.5 HSBC Holdings PlcExhibit 125: HSBC Holdings Plc - OverviewExhibit 126: HSBC Holdings Plc - Business segmentsExhibit 127: HSBC Holdings Plc - Key newsExhibit 128: HSBC Holdings Plc - Key offeringsExhibit 129: HSBC Holdings Plc - Segment focus12.6 IBK Industrial Bank of KoreaExhibit 130: IBK Industrial Bank of Korea - OverviewExhibit 131: IBK Industrial Bank of Korea - Product / ServiceExhibit 132: IBK Industrial Bank of Korea - Key offerings12.7 JPMorgan Chase and Co.Exhibit 133: JPMorgan Chase and Co. - OverviewExhibit 134: JPMorgan Chase and Co. - Business segmentsExhibit 135: JPMorgan Chase and Co. - Key offeringsExhibit 136: JPMorgan Chase and Co. - Segment focus12.8 KB Financial Group Inc.Exhibit 137: KB Financial Group Inc. - OverviewExhibit 138: KB Financial Group Inc. - Business segmentsExhibit 139: KB Financial Group Inc. - Key offeringsExhibit 140: KB Financial Group Inc. - Segment focus12.9 Mogo Inc.Exhibit 141: Mogo Inc. - OverviewExhibit 142: Mogo Inc. - Product / ServiceExhibit 143: Mogo Inc. - Key offerings12.10 National Bank of Kuwait S.A.K.PExhibit 144: National Bank of Kuwait S.A.K.P - OverviewExhibit 145: National Bank of Kuwait S.A.K.P - Business segmentsExhibit 146: National Bank of Kuwait S.A.K.P - Key offeringsExhibit 147: National Bank of Kuwait S.A.K.P - Segment focus12.11 NH Investment and Securities Co. Ltd.Exhibit 148: NH Investment and Securities Co. Ltd. - OverviewExhibit 149: NH Investment and Securities Co. Ltd. - Product / ServiceExhibit 150: NH Investment and Securities Co. Ltd. - Key offerings12.12 Shinhan Financial Group Co. Ltd.Exhibit 151: Shinhan Financial Group Co. Ltd. - OverviewExhibit 152: Shinhan Financial Group Co. Ltd. - Business segmentsExhibit 153: Shinhan Financial Group Co. Ltd. - Key offeringsExhibit 154: Shinhan Financial Group Co. Ltd. - Segment focus13 Appendix
13.1 Scope of the report13.2 Inclusions and exclusions checklistExhibit 155: Inclusions checklistExhibit 156: Exclusions checklist13.3 Currency conversion rates for US$Exhibit 157: Currency conversion rates for US$13.4 Research methodologyExhibit 158: Research methodologyExhibit 159: Validation techniques employed for market sizingExhibit 160: Information sources13.5 List of abbreviationsExhibit 161: List of abbreviationsdemand for infrastructure-as-a-service (IaaS): The ongoing migration from on-premise infrastructure to cloud-based services is having an impact on the revenues of original equipment manufacturers (OEMs) of servers, albeit the adverse impact on them is slightly milder than the effect on storage equipment. The emergence of IaaS has had a strong impact on the IT hardware market. The biggest advantage of IaaS is that it allows enterprises to scale operations or introduce innovations in the workflow without the need to make substantial investments in storage and servers for the traditional on-premise hardware environment. At the same time, cloud-focused infrastructure spending is expected to increase in terms of server, disk storage, and networking hardware.About Us
Technavio is a leading global technology research and advisory company. Their research and analysis focus on emerging market trends and provides actionable insights to help businesses identify market opportunities and develop effective strategies to optimize their market positions. With over 500 specialized analysts, Technavio's report library consists of more than 17,000 reports and counting, covering 800 technologies, spanning across 50 countries. Their client base consists of enterprises of all sizes, including more than 100 Fortune 500 companies. This growing client base relies on Technavio's comprehensive coverage, extensive research, and actionable market insights to identify opportunities in existing and potential markets and assess their competitive positions within changing market scenarios.
Contact
Technavio Research
Jesse Maida
Media & Marketing Executive
US: +1 844 364 1100
UK: +44 203 893 3200
Email: [email protected]
Website: www.technavio.com/
SOURCE Prnewswire


Sign in to leave a comment.