Siding market insights -
Technavio has announced its latest market research report titled Global Siding Market 2023-2027Vendors: 15+, Including Boral Ltd., Docke Extrusion LLC, Etex NV, James Hardie Industries plc, Kaycan Ltd., Kingspan Group Plc, Knauf Digital GmbH, Koch Industries Inc., Koch Konstruction Inc, LIXIL Corp., Louisiana Pacific Corp., Nichiha, Ply Gem Residential Solutions, Revelstone, ROCKWOOL International AS, The Alumasc Group plc, Valmont Industries Inc., Westlake Corp., Wienerberger AG, and Woodtone among othersCoverage: Key drivers, major trends, and challenges; customer and vendor landscape; vendor product insights and recent developments; key vendors; and market positioning of vendorsSegments: End-user (residential, commercial, and public infrastructure), material (vinyl, fiber cement, wood, and others), and geography (APAC, North America, Europe, Middle East and Africa, and South America).
To understand more about the information services market, request a sample report
The siding market report provides critical information and factual data, with a qualitative and quantitative study of the market based on market drivers and limitations as well as future prospects.
Why Buy?
Add credibility to strategyAnalyzes competitor's offerings Get a holistic view of the marketGrow your profit margin with Technavio- Buy the Report
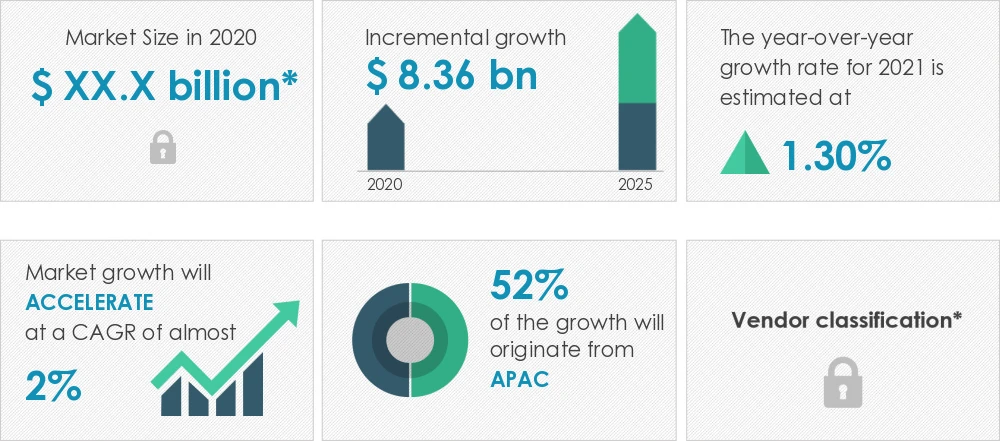
The report includes historic market data from 2017 to 2021. In 2017, the siding market was valued at USD 80.13 billion. From a regional perspective, APAC held the largest market share, valued at USD 38.24 billion. The siding market size is estimated to grow by USD 20.01 billion from 2022 to 2027 at a CAGR of 4.11% according to Technavio.
Siding market - Customer Landscape
To help companies evaluate and develop growth strategies, the report outlines –
Siding market - Vendor Insights
The growing competition in the market is compelling vendors to adopt various growth strategies such as promotional activities and spending on advertisements to improve the visibility of their services. Technavio report analyzes the market's competitive landscape and offers information on several market vendors including -
Boral Ltd: The company offers siding solutions such as Boral TruExterior Siding.Etex NV: The company offers siding solutions and related products such as UrbanPro fiber cement sheets.James Hardie Industries PLC: The company offers siding solutions such as Magnolia Home Collection.Siding market – Market dynamics
Major Drivers –
Booming global construction industryIncreasing disposable incomesGrowth of the travel industryKEY Challenges –
Low adoption of sidings in developingShortage of skilled laborEnvironmental impact of vinyl sidingWhat are the key data covered in this siding market report?
CAGR of the market during the forecast periodDetailed information on factors that will drive the growth of the siding market between 2023 and 2027Precise estimation of the size of the siding market and its contribution to the parent marketAccurate predictions about upcoming trends and changes in consumer behaviorGrowth of the siding market across APAC, North America, Europe, Middle East and Africa, and South AmericaA thorough analysis of the market's competitive landscape and detailed information about vendorsComprehensive analysis of factors that will challenge the growth of siding market vendorsGain instant access to 17,000+ market research reports.
Technavio's SUBSCRIPTION platform
Related Reports:
Ceramic Tiles Market by End-user, Product, and Geography - Forecast and Analysis 2023-2027: The ceramic tiles market is estimated to grow at a CAGR of 6.78% between 2022 and 2027. The size of the market is forecasted to increase by USD 37,011.59 million. The booming flooring industry is notably driving the market growth, although factors such as the disadvantages of ceramic tiles may impede the market growth.
Vinyl Flooring Market by End-user, Product, and Geography - Forecast and Analysis 2023-2027: The vinyl flooring market is estimated to grow at a CAGR of 6.89% between 2022 and 2027. The size of the market is forecast to increase by USD 11,531.07 million. The low cost and easy maintenance are notably driving the market growth, although factors such as the high competition from substitutes may impede the market growth.
Siding Market Scope
Report Coverage
Details
Page number
174
Base year
2022
Historic period
2017-2021
Forecast period
2023-2027
Growth momentum & CAGR
Accelerate at a CAGR of 4.11%
Market growth 2023-2027
USD 20.01 billion
Market structure
Fragmented
YoY growth 2022-2023 (%)
3.65
Regional analysis
APAC, North America, Europe, Middle East and Africa, and South America
Performing market contribution
APAC at 58%
Key countries
US, China, India, UK, and France
Competitive landscape
Leading Vendors, Market Positioning of Vendors, Competitive Strategies, and Industry Risks
Key companies profiled
Boral Ltd., Docke Extrusion LLC, Etex NV, James Hardie Industries plc, Kaycan Ltd., Kingspan Group Plc, Knauf Digital GmbH, Koch Industries Inc., Koch Konstruction Inc, LIXIL Corp., Louisiana Pacific Corp., Nichiha, Ply Gem Residential Solutions, Revelstone, ROCKWOOL International AS, The Alumasc Group plc, Valmont Industries Inc., Westlake Corp., Wienerberger AG, and Woodtone
Market dynamics
Parent Market Analysis; Market growth inducers and obstacles; Fast-growing and slow-growing segment analysis for the forecast period
Customization purview
If our report has not included the data that you are looking for, you can reach out to our analysts and get segments customized.
Browse for Technavio "Materials" Research Reports
Table of Contents
1 Executive Summary
1.1 Market overview Exhibit 01: Executive Summary – Chart on Market OverviewExhibit 02: Executive Summary – Data Table on Market OverviewExhibit 03: Executive Summary – Chart on Global Market CharacteristicsExhibit 04: Executive Summary – Chart on Market by GeographyExhibit 05: Executive Summary – Chart on Market Segmentation by End-userExhibit 06: Executive Summary – Chart on Market Segmentation by MaterialExhibit 07: Executive Summary – Chart on Incremental GrowthExhibit 08: Executive Summary – Data Table on Incremental GrowthExhibit 09: Executive Summary – Chart on Vendor Market Positioning2 Market Landscape
2.1 Market ecosystem Exhibit 10: Parent marketExhibit 11: Market Characteristics3 Market Sizing
3.1 Market definition Exhibit 12: Offerings of vendors included in the market definition3.2 Market segment analysis Exhibit 13: Market segments3.3 Market size 20223.4 Market outlook: Forecast for 2022-2027 Exhibit 14: Chart on Global - Market size and forecast 2022-2027 ($ billion)Exhibit 15: Data Table on Global - Market size and forecast 2022-2027 ($ billion)Exhibit 16: Chart on Global Market: Year-over-year growth 2022-2027 (%)Exhibit 17: Data Table on Global Market: Year-over-year growth 2022-2027 (%)4 Historic Market Size
4.1 Global siding market 2017 - 2021 Exhibit 18: Historic Market Size – Data Table on Global siding market 2017 - 2021 ($ billion)4.2 End-user Segment Analysis 2017 - 2021 Exhibit 19: Historic Market Size – End-user Segment 2017 - 2021 ($ billion)4.3 Material Segment Analysis 2017 - 2021 Exhibit 20: Historic Market Size – Material Segment 2017 - 2021 ($ billion)4.4 Geography Segment Analysis 2017 - 2021 Exhibit 21: Historic Market Size – Geography Segment 2017 - 2021 ($ billion)4.5 Country Segment Analysis 2017 - 2021 Exhibit 22: Historic Market Size – Country Segment 2017 - 2021 ($ billion)5 Five Forces Analysis
5.1 Five forces summary Exhibit 23: Five forces analysis - Comparison between 2022 and 20275.2 Bargaining power of buyers Exhibit 24: Chart on Bargaining power of buyers – Impact of key factors 2022 and 20275.3 Bargaining power of suppliers Exhibit 25: Bargaining power of suppliers – Impact of key factors in 2022 and 20275.4 Threat of new entrants Exhibit 26: Threat of new entrants – Impact of key factors in 2022 and 20275.5 Threat of substitutes Exhibit 27: Threat of substitutes – Impact of key factors in 2022 and 20275.6 Threat of rivalry Exhibit 28: Threat of rivalry – Impact of key factors in 2022 and 20275.7 Market condition Exhibit 29: Chart on Market condition - Five forces 2022 and 20276 Market Segmentation by End-user
6.1 Market segments Exhibit 30: Chart on End-user - Market share 2022-2027 (%)Exhibit 31: Data Table on End-user - Market share 2022-2027 (%)6.2 Comparison by End-user Exhibit 32: Chart on Comparison by End-userExhibit 33: Data Table on Comparison by End-user6.3 Residential - Market size and forecast 2022-2027Exhibit 34: Chart on Residential - Market size and forecast 2022-2027 ($ billion)Exhibit 35: Data Table on Residential - Market size and forecast 2022-2027 ($ billion)Exhibit 36: Chart on Residential - Year-over-year growth 2022-2027 (%)Exhibit 37: Data Table on Residential - Year-over-year growth 2022-2027 (%)6.4 Commercial - Market size and forecast 2022-2027Exhibit 38: Chart on Commercial - Market size and forecast 2022-2027 ($ billion)Exhibit 39: Data Table on Commercial - Market size and forecast 2022-2027 ($ billion)Exhibit 40: Chart on Commercial - Year-over-year growth 2022-2027 (%)Exhibit 41: Data Table on Commercial - Year-over-year growth 2022-2027 (%)6.5 Public infrastructure - Market size and forecast 2022-2027 Exhibit 42: Chart on Public infrastructure - Market size and forecast 2022-2027 ($ billion)Exhibit 43: Data Table on Public infrastructure - Market size and forecast 2022-2027 ($ billion)Exhibit 44: Chart on Public infrastructure - Year-over-year growth 2022-2027 (%)Exhibit 45: Data Table on Public infrastructure - Year-over-year growth 2022-2027 (%)6.6 Market opportunity by End-user Exhibit 46: Market opportunity by End-user ($ billion)7 Market Segmentation by Material
7.1 Market segments Exhibit 47: Chart on Material - Market share 2022-2027 (%)Exhibit 48: Data Table on Material - Market share 2022-2027 (%)7.2 Comparison by Material Exhibit 49: Chart on Comparison by MaterialExhibit 50: Data Table on Comparison by Material7.3 Vinyl - Market size and forecast 2022-2027Exhibit 51: Chart on Vinyl - Market size and forecast 2022-2027 ($ billion)Exhibit 52: Data Table on Vinyl - Market size and forecast 2022-2027 ($ billion)Exhibit 53: Chart on Vinyl - Year-over-year growth 2022-2027 (%)Exhibit 54: Data Table on Vinyl - Year-over-year growth 2022-2027 (%)7.4 Fiber cement - Market size and forecast 2022-2027Exhibit 55: Chart on Fiber cement - Market size and forecast 2022-2027 ($ billion)Exhibit 56: Data Table on Fiber cement - Market size and forecast 2022-2027 ($ billion)Exhibit 57: Chart on Fiber cement - Year-over-year growth 2022-2027 (%)Exhibit 58: Data Table on Fiber cement - Year-over-year growth 2022-2027 (%)7.5 Wood - Market size and forecast 2022-2027Exhibit 59: Chart on Wood - Market size and forecast 2022-2027 ($ billion)Exhibit 60: Data Table on Wood - Market size and forecast 2022-2027 ($ billion)Exhibit 61: Chart on Wood - Year-over-year growth 2022-2027 (%)Exhibit 62: Data Table on Wood - Year-over-year growth 2022-2027 (%)7.6 Others - Market size and forecast 2022-2027Exhibit 63: Chart on Others - Market size and forecast 2022-2027 ($ billion)Exhibit 64: Data Table on Others - Market size and forecast 2022-2027 ($ billion)Exhibit 65: Chart on Others - Year-over-year growth 2022-2027 (%)Exhibit 66: Data Table on Others - Year-over-year growth 2022-2027 (%)7.7 Market opportunity by Material Exhibit 67: Market opportunity by Material ($ billion)8 Customer Landscape
8.1 Customer landscape overview Exhibit 68: Analysis of price sensitivity, lifecycle, customer purchase basket, adoption rates, and purchase criteria9 Geographic Landscape
9.1 Geographic segmentation Exhibit 69: Chart on Market share by geography 2022-2027 (%)Exhibit 70: Data Table on Market share by geography 2022-2027 (%)9.2 Geographic comparison Exhibit 71: Chart on Geographic comparisonExhibit 72: Data Table on Geographic comparison9.3 APAC - Market size and forecast 2022-2027Exhibit 73: Chart on APAC - Market size and forecast 2022-2027 ($ billion)Exhibit 74: Data Table on APAC - Market size and forecast 2022-2027 ($ billion)Exhibit 75: Chart on APAC - Year-over-year growth 2022-2027 (%)Exhibit 76: Data Table on APAC - Year-over-year growth 2022-2027 (%)9.4 North America - Market size and forecast 2022-2027Exhibit 77: Chart on North America - Market size and forecast 2022-2027 ($ billion)Exhibit 78: Data Table on North America - Market size and forecast 2022-2027 ($ billion)Exhibit 79: Chart on North America - Year-over-year growth 2022-2027 (%)Exhibit 80: Data Table on North America - Year-over-year growth 2022-2027 (%)9.5 Europe - Market size and forecast 2022-2027Exhibit 81: Chart on Europe - Market size and forecast 2022-2027 ($ billion)Exhibit 82: Data Table on Europe - Market size and forecast 2022-2027 ($ billion)Exhibit 83: Chart on Europe - Year-over-year growth 2022-2027 (%)Exhibit 84: Data Table on Europe - Year-over-year growth 2022-2027 (%)9.6 Middle East and Africa - Market size and forecast 2022-2027 Exhibit 85: Chart on Middle East and Africa - Market size and forecast 2022-2027 ($ billion)Exhibit 86: Data Table on Middle East and Africa - Market size and forecast 2022-2027 ($ billion)Exhibit 87: Chart on Middle East and Africa - Year-over-year growth 2022-2027 (%)Exhibit 88: Data Table on Middle East and Africa - Year-over-year growth 2022-2027 (%)9.7 South America - Market size and forecast 2022-2027Exhibit 89: Chart on South America - Market size and forecast 2022-2027 ($ billion)Exhibit 90: Data Table on South America - Market size and forecast 2022-2027 ($ billion)Exhibit 91: Chart on South America - Year-over-year growth 2022-2027 (%)Exhibit 92: Data Table on South America - Year-over-year growth 2022-2027 (%)9.8 China - Market size and forecast 2022-2027Exhibit 93: Chart on China - Market size and forecast 2022-2027 ($ billion)Exhibit 94: Data Table on China - Market size and forecast 2022-2027 ($ billion)Exhibit 95: Chart on China - Year-over-year growth 2022-2027 (%)Exhibit 96: Data Table on China - Year-over-year growth 2022-2027 (%)9.9 US - Market size and forecast 2022-2027Exhibit 97: Chart on US - Market size and forecast 2022-2027 ($ billion)Exhibit 98: Data Table on US - Market size and forecast 2022-2027 ($ billion)Exhibit 99: Chart on US - Year-over-year growth 2022-2027 (%)Exhibit 100: Data Table on US - Year-over-year growth 2022-2027 (%)9.10 India - Market size and forecast 2022-2027Exhibit 101: Chart on India - Market size and forecast 2022-2027 ($ billion)Exhibit 102: Data Table on India - Market size and forecast 2022-2027 ($ billion)Exhibit 103: Chart on India - Year-over-year growth 2022-2027 (%)Exhibit 104: Data Table on India - Year-over-year growth 2022-2027 (%)9.11 UK - Market size and forecast 2022-2027Exhibit 105: Chart on UK - Market size and forecast 2022-2027 ($ billion)Exhibit 106: Data Table on UK - Market size and forecast 2022-2027 ($ billion)Exhibit 107: Chart on UK - Year-over-year growth 2022-2027 (%)Exhibit 108: Data Table on UK - Year-over-year growth 2022-2027 (%)9.12 France - Market size and forecast 2022-2027Exhibit 109: Chart on France - Market size and forecast 2022-2027 ($ billion)Exhibit 110: Data Table on France - Market size and forecast 2022-2027 ($ billion)Exhibit 111: Chart on France - Year-over-year growth 2022-2027 (%)Exhibit 112: Data Table on France - Year-over-year growth 2022-2027 (%)9.13 Market opportunity by geography Exhibit 113: Market opportunity by geography ($ billion)10 Drivers, Challenges, and Trends
10.1 Market drivers10.2 Market challenges10.3 Impact of drivers and challenges Exhibit 114: Impact of drivers and challenges in 2022 and 202710.4 Market trends11 Vendor Landscape
11.1 Overview11.2 Vendor landscape Exhibit 115: Overview on Criticality of inputs and Factors of differentiation11.3 Landscape disruption Exhibit 116: Overview on factors of disruption11.4 Industry risks Exhibit 117: Impact of key risks on business12 Vendor Analysis
12.1 Vendors covered Exhibit 118: Vendors covered12.2 Market positioning of vendors Exhibit 119: Matrix on vendor position and classification12.3 Boral Ltd. Exhibit 120: Boral Ltd. - OverviewExhibit 121: Boral Ltd. - Business segmentsExhibit 122: Boral Ltd. - Key newsExhibit 123: Boral Ltd. - Key offeringsExhibit 124: Boral Ltd. - Segment focus12.4 Docke Extrusion LLC Exhibit 125: Docke Extrusion LLC - OverviewExhibit 126: Docke Extrusion LLC - Product / ServiceExhibit 127: Docke Extrusion LLC - Key offerings12.5 Etex NV Exhibit 128: Etex NV - OverviewExhibit 129: Etex NV - Business segmentsExhibit 130: Etex NV - Key newsExhibit 131: Etex NV - Key offeringsExhibit 132: Etex NV - Segment focus12.6 James Hardie Industries plc Exhibit 133: James Hardie Industries plc - OverviewExhibit 134: James Hardie Industries plc - Business segmentsExhibit 135: James Hardie Industries plc - Key offeringsExhibit 136: James Hardie Industries plc - Segment focus12.7 Kingspan Group Plc Exhibit 137: Kingspan Group Plc - OverviewExhibit 138: Kingspan Group Plc - Business segmentsExhibit 139: Kingspan Group Plc - Key newsExhibit 140: Kingspan Group Plc - Key offeringsExhibit 141: Kingspan Group Plc - Segment focus12.8 Knauf Digital GmbH Exhibit 142: Knauf Digital GmbH - OverviewExhibit 143: Knauf Digital GmbH - Product / ServiceExhibit 144: Knauf Digital GmbH - Key offerings12.9 Koch Industries Inc. Exhibit 145: Koch Industries Inc. - OverviewExhibit 146: Koch Industries Inc. - Product / ServiceExhibit 147: Koch Industries Inc. - Key newsExhibit 148: Koch Industries Inc. - Key offerings12.10 LIXIL Corp. Exhibit 149: LIXIL Corp. - OverviewExhibit 150: LIXIL Corp. - Business segmentsExhibit 151: LIXIL Corp. - Key offeringsExhibit 152: LIXIL Corp. - Segment focus12.11 Louisiana Pacific Corp. Exhibit 153: Louisiana Pacific Corp. - OverviewExhibit 154: Louisiana Pacific Corp. - Business segmentsExhibit 155: Louisiana Pacific Corp. - Key newsExhibit 156: Louisiana Pacific Corp. - Key offeringsExhibit 157: Louisiana Pacific Corp. - Segment focus12.12 Nichiha Exhibit 158: Nichiha - OverviewExhibit 159: Nichiha - Product / ServiceExhibit 160: Nichiha - Key offerings12.13 Ply Gem Residential Solutions Exhibit 161: Ply Gem Residential Solutions - OverviewExhibit 162: Ply Gem Residential Solutions - Product / ServiceExhibit 163: Ply Gem Residential Solutions - Key offerings12.14 Revelstone Exhibit 164: Revelstone - OverviewExhibit 165: Revelstone - Product / ServiceExhibit 166: Revelstone - Key offerings12.15 ROCKWOOL International AS Exhibit 167: ROCKWOOL International AS - OverviewExhibit 168: ROCKWOOL International AS - Business segmentsExhibit 169: ROCKWOOL International AS - Key offeringsExhibit 170: ROCKWOOL International AS - Segment focus12.16 The Alumasc Group plc Exhibit 171: The Alumasc Group plc - OverviewExhibit 172: The Alumasc Group plc - Business segmentsExhibit 173: The Alumasc Group plc - Key offeringsExhibit 174: The Alumasc Group plc - Segment focus12.17 Wienerberger AG Exhibit 175: Wienerberger AG - OverviewExhibit 176: Wienerberger AG - Business segmentsExhibit 177: Wienerberger AG - Key offeringsExhibit 178: Wienerberger AG - Segment focus13 Appendix
13.1 Scope of the report13.2 Inclusions and exclusions checklist Exhibit 179: Inclusions checklistExhibit 180: Exclusions checklist13.3 Currency conversion rates for US$ Exhibit 181: Currency conversion rates for US$13.4 Research methodology Exhibit 182: Research methodologyExhibit 183: Validation techniques employed for market sizingExhibit 184: Information sources13.5 List of abbreviations Exhibit 185: List of abbreviationsAbout Us
Technavio is a leading global technology research and advisory company. Their research and analysis focuses on emerging market trends and provides actionable insights to help businesses identify market opportunities and develop effective strategies to optimize their market positions. With over 500 specialized analysts, Technavio's report library consists of more than 17,000 reports and counting, covering 800 technologies, spanning across 50 countries. Their client base consists of enterprises of all sizes, including more than 100 Fortune 500 companies. This growing client base relies on Technavio's comprehensive coverage, extensive research, and actionable market insights to identify opportunities in existing and potential markets and assess their competitive positions within changing market scenarios.
Contact
Technavio Research
Jesse Maida
Media & Marketing Executive
US: +1 844 364 1100
UK: +44 203 893 3200
Email: media@technavio.com
Website: www.technavio.com/
SOURCE Prnewswire


Sign in to leave a comment.