
In the experience-driven ecosystem, enterprises of all sizes and verticals seek ways to adopt the data-driven culture. This shift arises because enterprise leaders need to process massive business application datasets and obtain reliable insights related to operations performance, market trends, customer behavior/preferences, etc. By acquiring such insights, leaders and stakeholders can make strategic operational optimization decisions and augment business growth. However, several business leaders and organizations continue to work with traditional data visualization tools for business application data processing and analysis. Though these tools are proficient in generating various visualizations, they necessitate users to manually extract, pre-process, transform, and upload data for processing and analysis.
Similarly, traditional data visualization tools lack real-time processing capabilities. This makes it difficult for business leaders to assess and visualize real-time application data streams and implement strategic optimization initiatives on time. That’s why organizations should consider replacing traditional visualization tools with AI-powered data visualization tools.
Implementing AI Data Visualization Tools with Skilled Service Provider
In general, AI data visualization tools consist of pre-built visualization models that are developed using machine learning (ML), natural language processing (NLP), and large language models (LLM). These models can be configured and integrated with business applications through APIs and connectors. This integration enables the models to extract, clean, structure, and analyze application data autonomously, thereby eliminating manual pre-processing efforts. Moreover, intelligent models effectively process real-time application data streams and generate interactive visualizations without delay.
However, to implement AI data visualization tools within the digital infrastructure, organizations should consider partnering with a reputable data visualization services provider. Dedicated data visualization experts assess the complexity of business applications and datasets and recommend the appropriate AI visualization tool for implementation. Besides, experts collaborate with organization’s leaders/stakeholders to understand their visualization needs and requirements. This enables them to customize visualization models and integrate them seamlessly with business applications to generate tailored metrics and insights.
Some other advantages of implementing AI visualization tools with dedicated services provider include:
- Robust Model Training – Data visualization experts program the APIs of visualization models to consistently extract data from business applications. Similarly, experts embed data cleansing, transformation, and processing conditions as the inputs to the models and train them to generate accurate and personalized visual insights.
- Ensuring User Adoption – By delivering extensive training sessions, data visualization experts ensure that leaders, analysts, and technical project stakeholders in organizations effectively work with AI visualization tools. The extensive adoption of AI visualization tools for application data processing and analysis enables leaders to make data-driven optimization decisions and embrace a data-driven culture.
- Security and Compliance Considerations – After configuring and integrating AI-powered visualization models with enterprise applications, dedicated visualization experts set up adequate security mechanisms. By incorporating mechanisms like encryption, user access control, and audit logging within the models, experts ensure highly secure and compliant app data visualization for businesses.
Key Use Cases of AI Data Visualization
By configuring and integrating AI-powered models with a range of business applications, visualization experts help organizations modernize processes and improve operational efficiency. Here are some of the key AI visualization models that experts configure and integrate with enterprise solutions:
1. Sales Forecast Visualization Model
AI data visualization tools offer pre-built sales forecast visualization models that can be configured and incorporated with sales CRM. The sales forecast visualization model leverages machine learning (ML)-based time series forecasting algorithms to analyze massive historical sales data and generate visual metrics or insights. By hiring experts from a reputable data visualization company, organizations can seamlessly integrate the forecast visualization model with the existing sales CRM.
For effective analysis of sales data, data visualization experts train the sales forecast model with reference sales datasets. After the training phase, experts integrate the model with sales CRM through APIs. This integration enables the model to extract accumulated sales/customer records from CRM. Consequently, visualization experts program the underlying time series algorithm to process the extracted sales/customer records and general visual insights related to future sales performance over time, customer preferences, and churn prediction. These insights enable sales administrators to optimize strategies and improve customer retention or satisfaction rates.
2. Supply Chain Inventory Monitoring Model
The supply chain inventory monitoring model offered by AI-powered data visualization tools is highly valuable for logistics teams in organizations. This model is developed using a combination of reinforcement learning and long short-term memory (LSTM) algorithms. By integrating this model into enterprise logistics management applications, supply chain administrators can visualize inventory in real time and forecast inventory demands effectively. AI data visualization experts effectively integrate the inventory monitoring model with logistics management applications through custom APIs/connectors.
After integration, experts program the monitoring model to consistently capture IoT sensor data from the logistics applications and display chart-based stock levels in real time. Consequently, the underlying LTSM and reinforcement learning algorithm track stock levels and offer predictive insights on potential inventory overstocking or shortage scenarios. By leveraging these insights, supply chain administrators can proactively monitor and replenish inventory and minimize revenue risks.
3. Project Productivity Monitoring Model
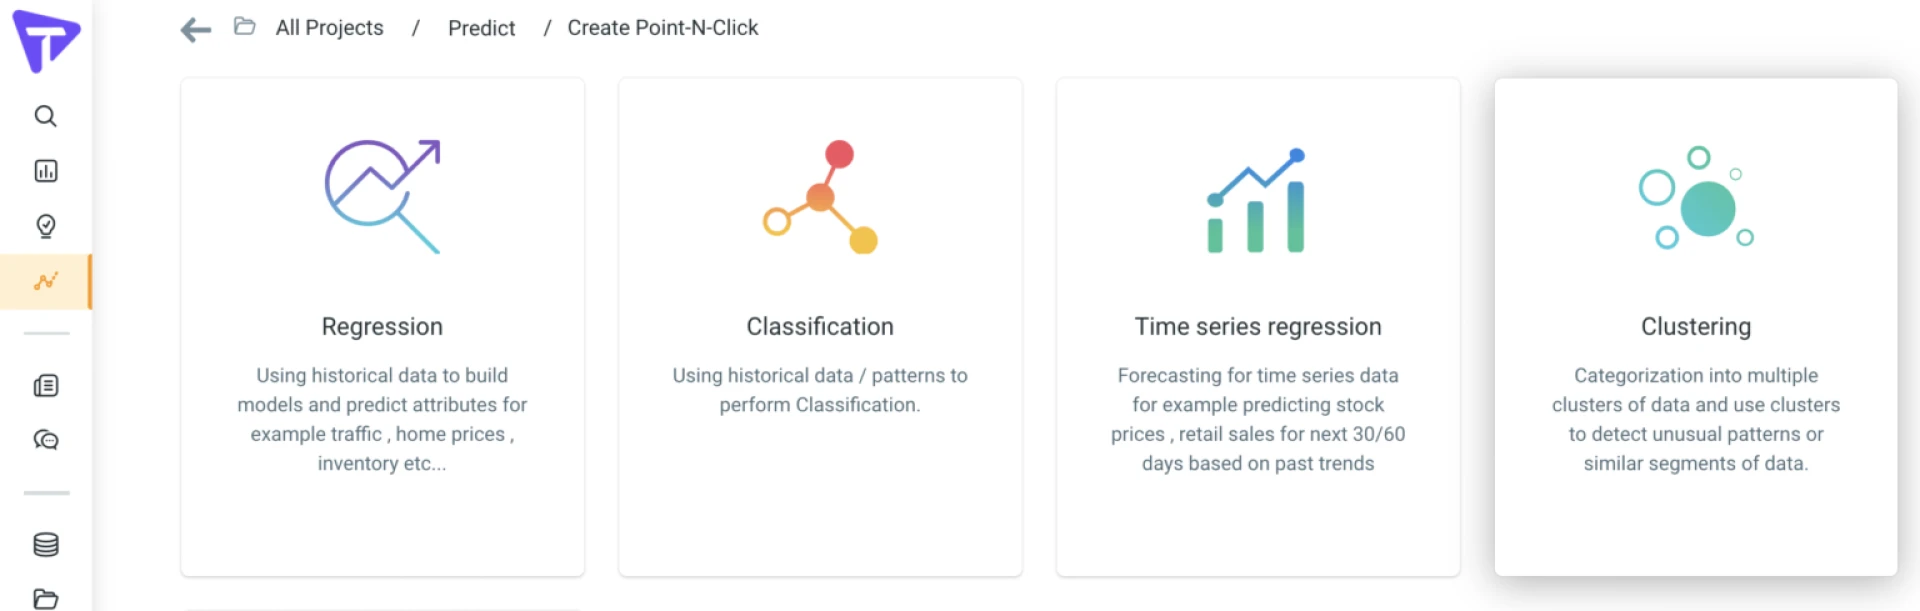
Another key model offered by AI visualization tools is the project productivity monitoring model. This model leverages ML-based regression algorithms to assess and identify relationships between various project data points and variables. Visualization experts configure and integrate the model within functional project management tools to generate visual insights related to project progress and productivity.
By integrating the project productivity model with project management tools, experts program the model to extract key data points like project timelines, team resource utilization, task completion rates, and budget adherence. Consequently, data visualization experts train the underlying regression algorithm to assess and identify relationships between project data points effectively. This enables the project productivity model to display visual metrics related to overall team performance, budget adherence, and resource efficiency. These insights enable project managers to optimize project planning and resource allocation strategies and improve overall productivity.
Closing Thoughts
In essence, AI data visualization tools and intuitive models possess the potential to process massive data generated by enterprise applications and offer detailed visual insights. However, to customize the visualization models and integrate them effectively with functional enterprise applications, organizations should consider hiring experts from recognized data visualization firms. These experts follow time-tested practices for configuring and integrating AI visualization models with the applications. Moreover, experts embed robust encryption and access control mechanisms within the visualization models, ensuring greater data visualization security and privacy for organizations.


Sign in to leave a comment.