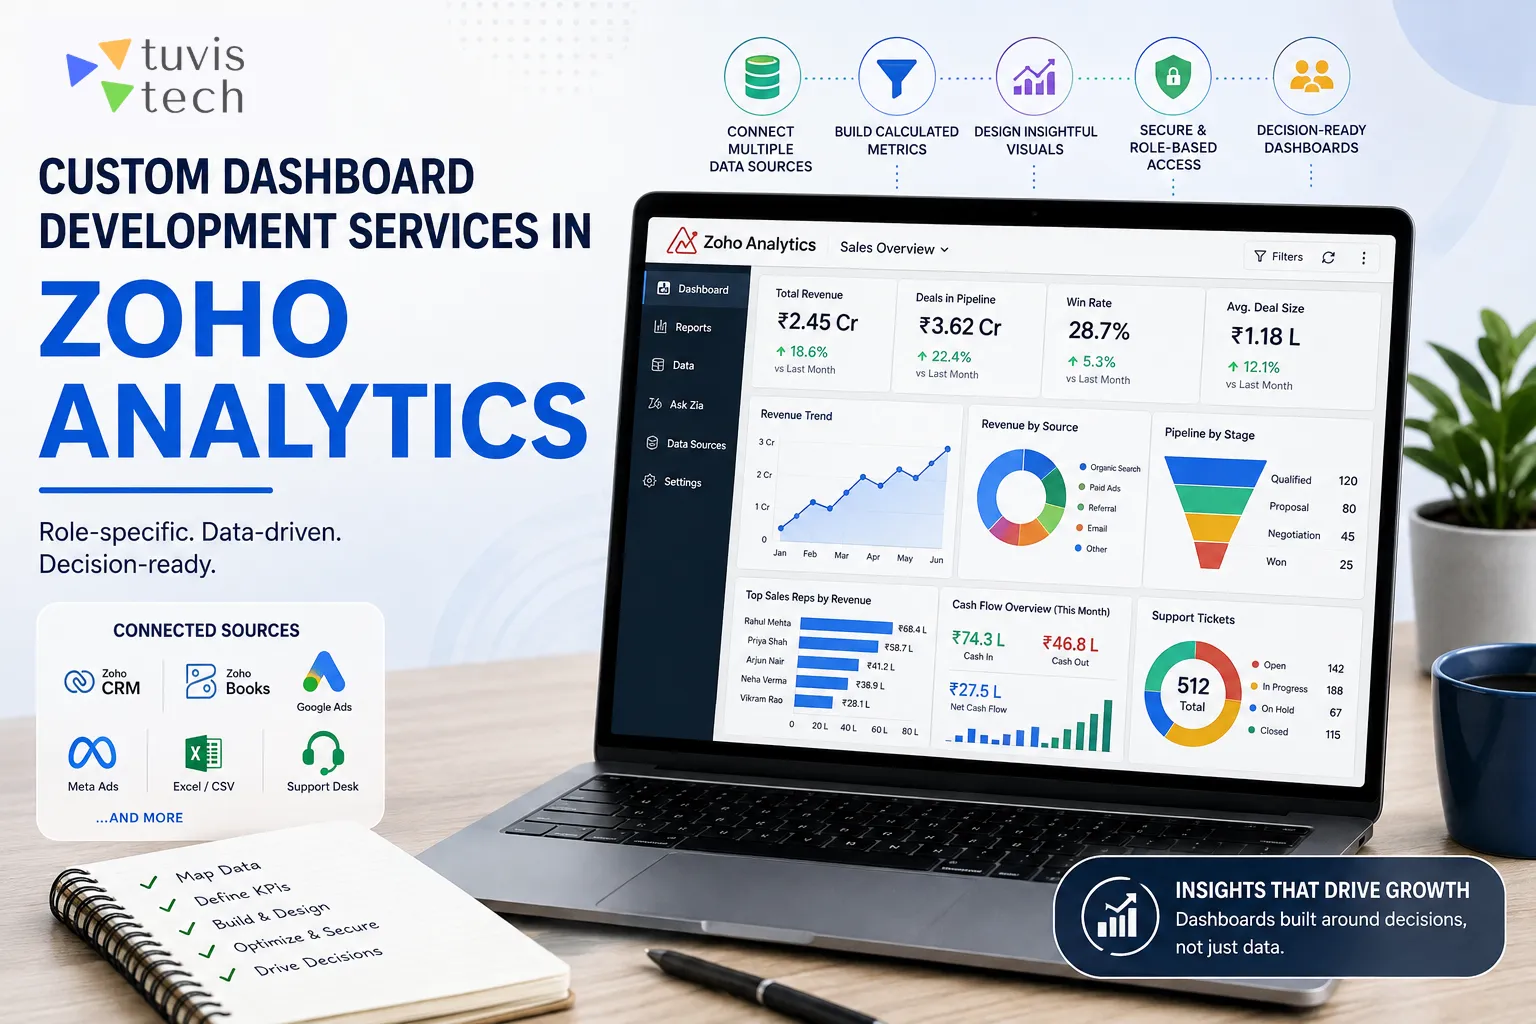

Quick answer: Custom dashboard development in Zoho Analytics means designing role-specific, decision-ready visualizations instead of relying on default reports. It involves connecting multiple data sources (CRM, Books, marketing platforms, spreadsheets), building calculated metrics with formulas or Zia-assisted queries, and structuring the layout so each stakeholder (CEO, sales head, finance) sees only the KPIs relevant to their role.
Most businesses running Zoho Analytics never move past the auto-generated dashboards created during setup. Those defaults pull raw fields into generic charts and call it reporting. A custom dashboard is built the other way around: start with the decision someone needs to make, then work backward to the exact metrics, filters, and visual format that support it. This is usually where a Zoho consulting engagement earns its cost, closing the gap between a dashboard people check and one people ignore after week two.
Why Default Dashboards Fail Most Teams
Three patterns show up consistently in Zoho Analytics environments that were never customized:
- Too many charts, no hierarchy. Every field gets its own widget, so the one number that matters (this week's pipeline, this month's cash position) is buried among a dozen others.
- No source blending. Sales data sits separate from marketing spend and support tickets, so nobody can see cost-per-lead against actual close rate on one screen.
- Static views for dynamic roles. A single dashboard tries to serve the CEO, the sales manager, and the finance team simultaneously, satisfying none of them well.
Zoho Analytics itself has been built out significantly to solve this. The platform's Q1 2026 update added the ability to build fully custom chart visualizations using JavaScript libraries and expanded connectivity with nine new data connectors, including Zoho FSM, Tally Prime, and Adobe Commerce, specifically to support more tailored, blended dashboards.
What Custom Dashboard Development Actually Involves
1. Data Source Mapping
Before any chart gets built, every relevant data source gets identified: Zoho CRM for pipeline and deal data, Zoho Books for cash and receivables, ad platforms for spend, and any spreadsheet-based data still living outside Zoho. Archive Data settings are configured at this stage too, so historical records stay accessible without slowing down live queries.
2. Role-Based KPI Definition
Each dashboard is scoped to a single audience. A CEO view surfaces revenue, cash position, pipeline health, and churn on one screen. A sales manager view drills into rep-level activity, deal aging, and win rate. Building both into one dashboard is the most common reason custom builds get requested after a generic Zoho Analytics rollout.
3. Calculated Metrics and Formulas
Raw fields rarely answer the actual question. Formulas convert stored data into decision metrics such as customer acquisition cost, deal velocity, or forecast accuracy. Zoho Analytics' Formula Suggester, now enhanced with OpenAI integration, speeds this step up by recommending formulas based on the connected table's data model.
4. Visual and Interaction Design
This covers chart selection (avoiding pie charts for anything with more than four segments), drill-down configuration so a summary card can expand into transaction-level detail, and layout formatting using Zoho Analytics' theme and resizing options for A3, A4, Letter, or custom widths depending on whether the dashboard is viewed on screen or exported.
5. Governance and Access Control
Role-based sharing, embed permissions, and white-label security settings are configured so each stakeholder group sees their scoped view and nothing beyond it. This matters most for dashboards shared with external partners, investors, or franchise locations.
Default Setup vs. Custom Dashboard Development
| Factor | Default Zoho Analytics Setup | Custom Dashboard Development |
|---|---|---|
| Data sources | Single connected app, typically CRM or Books | Multiple sources blended (CRM, Books, ads, support, spreadsheets) |
| Metrics shown | Raw field counts and sums | Calculated KPIs tied to specific decisions |
| Audience | One generic view for all users | Role-specific dashboards per stakeholder |
| Chart selection | Auto-generated, often mismatched to data type | Manually selected to match metric behavior |
| Load performance | Slows as historical data grows | Optimized with Archive Data and query tuning |
| Adoption | Checked once, then ignored | Opened daily as a working decision tool |
Frequently Asked Questions
How long does custom dashboard development in Zoho Analytics take?
A single-department dashboard (sales or finance) typically takes one to two weeks, covering data mapping, KPI definition, and build. Multi-department dashboards with blended data sources across CRM, Books, and marketing platforms usually run three to five weeks depending on data cleanliness.
Can Zoho Analytics dashboards pull data from outside the Zoho ecosystem?
Yes. Zoho Analytics connects to external databases, cloud storage, and third-party business applications including ad platforms, payment gateways, and spreadsheet files, and recently added connectors for tools like Adobe Commerce and Constant Contact for broader source blending.
What is the difference between a Zoho Analytics report and a dashboard?
A report is a single table or chart built from one query. A dashboard combines multiple reports, KPI widgets, and filters into one interactive view, allowing a user to drill from a summary number into the underlying transactions without leaving the screen.
Does a custom dashboard require rebuilding existing Zoho Analytics reports?
Not usually. Most existing reports can be reused as building blocks inside a new dashboard layout. The customization work is in selecting which reports matter, defining the calculated metrics that connect them, and structuring the layout around a specific decision-maker's needs.
Getting a Dashboard People Actually Use
A Zoho Analytics dashboard only earns its place if someone opens it before their first meeting, not once during onboarding and never again. Tuvis Tech builds custom dashboards inside Zoho Analytics around the specific decisions each stakeholder needs to make, blending data across Zoho CRM and other connected apps rather than shipping a generic template. This work is typically scoped as part of a broader Zoho consulting engagement, so dashboard design lines up with how the rest of the Zoho stack is configured, not built in isolation.
Sources
- Zoho Analytics, Q1 2026 Product Update
- Zoho Analytics, What's New
- Zoho Analytics, Product Overview
- Zoho Analytics Help, Customizing a Dashboard























Sign in to leave a comment.