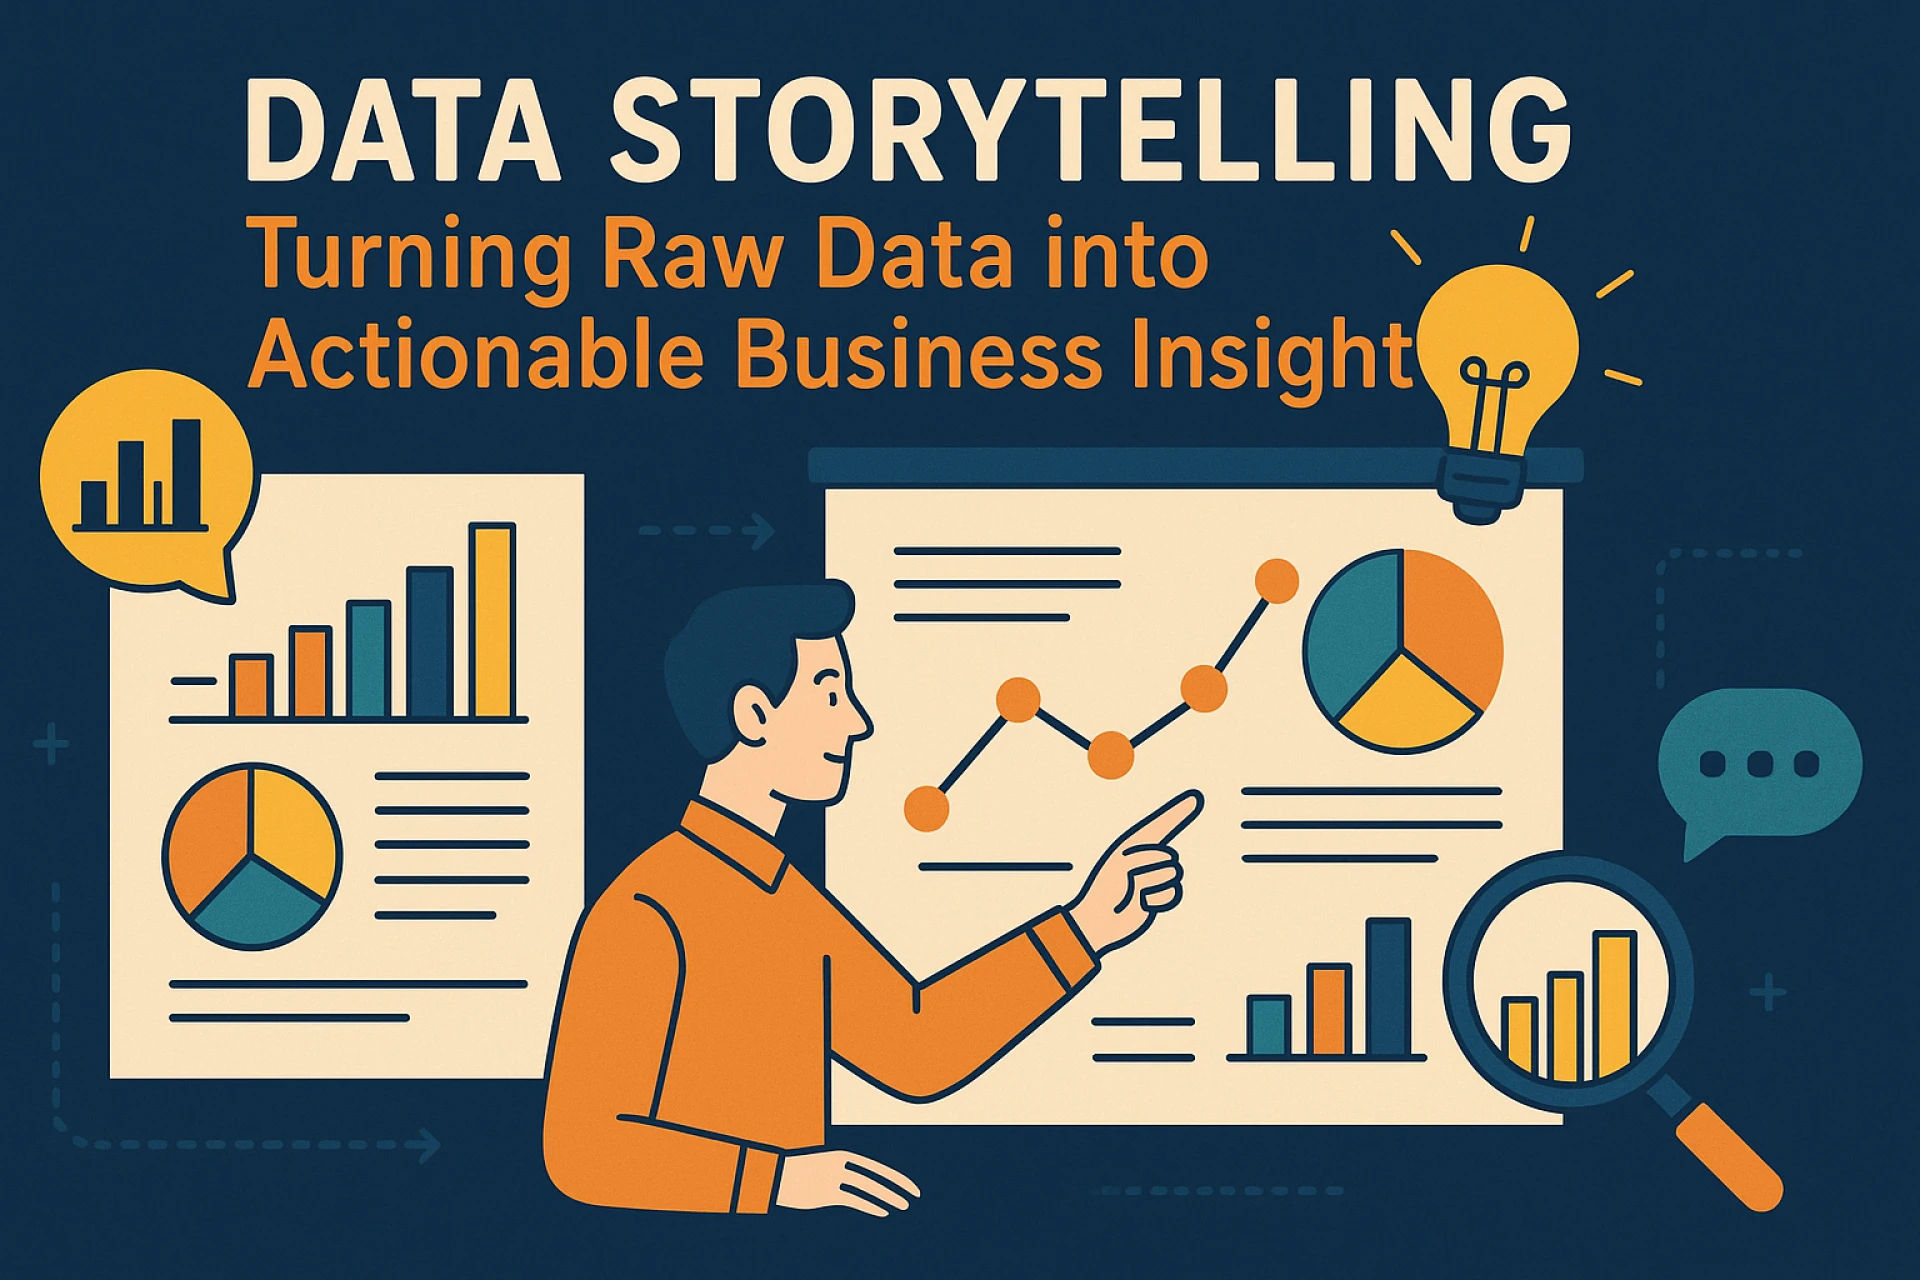
Most companies collect terabytes of information—web-site clicks, call-centre logs, sensor reading—yet still struggle to act on it. The missing link is not more data or even better models; it is narrative. Data storytelling weaves numbers, visuals, and business context into a cohesive tale that guides decisions. Done well, it trims hours of debate, rallies teams behind a strategy, and accelerates return on analytics investments.
UNDERSTAND YOUR AUDIENCE BEFORE YOU TOUCH THE DATA
Every story starts with a listener. Executives want revenue impact and risk exposure; product managers care about feature adoption; customer-service leaders need churn drivers. Listing audience roles and their top questions helps you filter irrelevant variables early. For example, a CFO evaluating regional performance does not need row-level transaction IDs—she needs margin trends and the factors influencing them.
MOVE FROM EXPLORATION TO NARRATIVE STRUCTURE
Exploratory data analysis (EDA) reveals patterns through summary statistics, correlations, and cluster plots. Storytelling begins when you map those findings to a classic structure:
- Context – Why should the listener care?
- Conflict – What problem blocks success?
- Resolution – Which insight clears the path, and what action follows?
- This format translates even complex regressions into clear, memorable arcs. Instead of “Model accuracy is 88 percent,” say, “Late deliveries spike by 42 percent when warehouse utilisation crosses 90 percent—shifting two routes to night shifts will save ₹3 crore this quarter.”
CHOOSE VISUALS THAT HIGHLIGHT, NOT DECORATE
Charts serve as supporting actors. Line graphs accentuate trends; bar charts compare categories; scatter plots expose relationships. Avoid 3-D, dual-axis scales, and rainbow palettes that distract from the message. Annotate key turning points directly on the plot—“Marketing campaign launch” or “New pricing introduced”—so the audience sees cause and effect instantly. Interactive dashboards add depth but should still open with a static “hero” view that tells the core story at a glance.
EMPLOY METRICS THAT CONNECT TO VALUE
Data storytellers translate technical outputs into business-speak. Confidence intervals become “range of likely outcomes”; F1 scores convert to “percentage of accurate fraud catches.” Always accompany ratios with absolute numbers—saying conversion jumped from 2 percent to 3 percent sounds small until you reveal it added 5 000 paying users. Establish a single “north-star” metric early; supporting KPIs then play the role of evidence, not the headline.
LEVERAGE ADVANCED TECHNIQUES WITHOUT LOSING CLARITY
Natural-language generation tools can draft narrative summaries of dashboards, while automated insights engines flag anomalies that warrant explanation. Yet human judgment remains crucial for context and nuance. For sensitive topics—such as gender pay gaps or safety incidents—combine quantitative findings with qualitative quotes or case studies to humanise the issue and build empathy.
TIE INSIGHTS TO A CALL-TO-ACTION
A story without a next step is entertainment, not strategy. Distil recommendations into a one-pager: action, owner, deadline, expected impact, and risk. Visual cues such as red–amber–green statuses or cost-benefit matrices help leaders prioritise. Follow up with a measurement plan so teams can see whether the enacted change moves the needle, closing the feedback loop and reinforcing a culture of evidence.
CULTIVATE ORGANISATIONAL STORYTELLING SKILLS
Many firms appoint a “data translator” role—people who understand analytics and speak business fluently. Upskilling programmes, brown-bag sessions, and peer reviews sharpen storytelling muscles. Professionals who enroll in a data analytics course in Bangalore often cite presentation drills and stakeholder simulation labs as the most transformative components, turning them from report builders into trusted advisors.
COMMON PITFALLS AND HOW TO AVOID THEM
- Data dump syndrome – Overloading slides with every slice undermines clarity. Curate ruthlessly.
- Cherry picking – Highlighting only favourable stats erodes credibility. Present the full picture, including uncertainty and limitations.
- Jargon overload – Replace “heteroscedasticity” with “variance changes as volume grows.” Plain language widens reach.
MEASURING STORY IMPACT
Track adoption metrics: percentage of strategic meetings that reference analytics, time from insight to decision, and lift in key KPIs after recommendations are implemented. Collect qualitative feedback—did stakeholders understand the takeaway in five minutes? These indicators show whether storytelling is driving action or merely adding decoration.
TOOLS OF THE TRADE
Excel and PowerPoint remain universal, but modern stacks include:
• Tableau/Power BI for interactive visuals.
• Python (pandas, Matplotlib, Seaborn) for custom plots.
• Narrative Science or Automated Insights for auto-generated summaries.
• Canva or Figma for polished slide artwork.
Practitioners learn to switch tools based on audience: a CEO deck may need crisp static infographics, while an operations manager benefits from a drill-down dashboard.
A NOTE ON DATA ETHICS
With powerful stories comes responsibility. Verify sources, anonymise sensitive fields, and disclose modelling assumptions. Overstating certainty or masking limitations can lead to costly missteps. Ethical storytelling not only protects reputation but also fosters long-term trust in data initiatives.
CONCLUSION
Data storytelling transforms raw numbers into decisions that boost revenue, cut costs, or delight customers. Start by understanding your audience, wrap insights in a clear narrative, support them with clean visuals, and finish with a concrete call-to-action. As organisations double down on analytics, the ability to craft compelling data narratives becomes a career accelerator. Structured learning paths—such as a data analytics course in Bangalore—equip analysts with both technical and communication skills, ensuring their insights spark change rather than gather digital dust. Master this craft and you’ll move stakeholders from “That’s interesting” to “Let’s do it” every time.


Sign in to leave a comment.