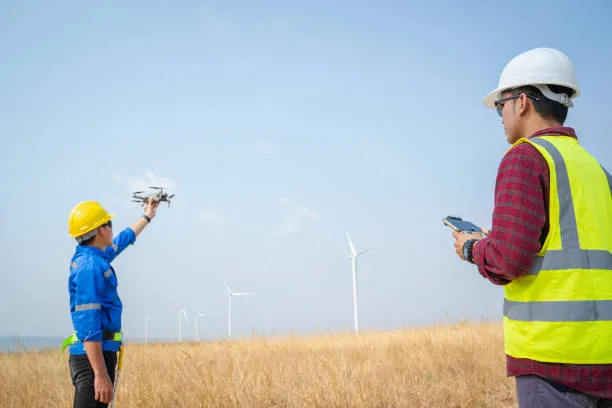

The renewable energy sector has a scale problem. Solar farms now sprawl across thousands of acres, offshore wind installations sit miles from shore in punishing conditions, and hydropower assets often occupy terrain that is dangerous or simply impossible to walk. Traditional inspection methods climbing towers, walking panel rows, sending divers into intake structures were never built for this scale, and it shows. Operators are discovering that the biggest threat to renewable ROI is not generation capacity. It is the blind spots in asset monitoring.
That is the gap drones have quietly stepped into over the last few years, and the shift is no longer experimental. It is operational.
Why Renewable Energy Assets Are So Hard to Monitor
Every renewable energy technology has its own inspection headache. Solar farms lose efficiency to micro-cracks, hotspots, and soiling that are invisible to the naked eye but catastrophic to output over time. Wind turbines develop blade erosion, delamination, and lightning strikes hundreds of feet in the air, in locations where rope-access inspections can take a technician the better part of a day per turbine. Hydropower and transmission infrastructure often sit in remote or hazardous terrain where manual inspection means real safety exposure for crews.
The common thread across all three is that problems are usually invisible until they have already cost money lost generation, unplanned downtime, or in worse cases, safety incidents. Catching these issues early requires two things ground crews simply cannot deliver at scale: frequency and resolution. You need eyes on every asset, often, and in enough detail to catch a hairline crack before it becomes a failure.
Where Drones Change the Equation
This is precisely the gap that aerial inspection was built to close. A single drone equipped with thermal and RGB sensors can survey a utility-scale solar array in a fraction of the time a ground crew would need, flagging hotspots, cracked cells, and wiring faults with pinpoint GPS coordinates attached to every anomaly. For wind assets, drones eliminate the need for rope-access technicians altogether on most routine inspections a UAV can capture high-resolution imagery of every blade surface from a safe hovering distance, cutting inspection time from a full day to under an hour per turbine in many cases.
What makes this genuinely useful rather than just a novelty is what happens after the flight. Raw aerial imagery is not the deliverable; it is the input. Providers offering drone inspection services for renewable energy assets pair the flight data with processing pipelines that turn thousands of images into orthomosaic maps, thermal anomaly reports, and defect logs an asset manager can actually act on often within 24 to 48 hours of the flight.
The Sensors Doing the Real Work
Not all aerial data is created equal, and this is where renewable energy inspection diverges sharply from generic drone photography.
Thermal imaging is the workhorse for solar. Panels under electrical stress run measurably hotter than their neighbors, and a thermal sensor flying overhead can flag that discrepancy instantly long before it is visible as physical damage or shows up in a production dip on the SCADA dashboard.
High-resolution RGB and zoom cameras handle the visual inspection side for wind blades, catching leading-edge erosion, cracking, and coating degradation that would otherwise only be caught during scheduled rope-access inspections, which happen far less frequently.
Multispectral sensors are increasingly used on solar farms sited near vegetation-heavy land, helping operators monitor site conditions, drainage, and encroachment that could affect long-term asset health.
LiDAR and photogrammetry come into play during the pre-construction and site assessment phase, generating the topographic accuracy needed for layout planning on wind and solar projects before a single panel or turbine goes in the ground.
From Images to Insight: The Data Analytics Layer
Here is where many drone programs in renewable energy actually fall short and it is not the flying. It is what happens to the data afterward. A folder of thousands of thermal images is not an inspection report. Without a structured analytics layer, most of that visual data ends up reviewed manually, inconsistently, or not at all.
The operators getting the most value out of aerial inspection are the ones treating the data pipeline as seriously as the flight itself feeding imagery into detection models that flag anomalies automatically, tracking defect trends across inspection cycles, and tying findings back to specific asset IDs so maintenance teams are not hunting for which panel or turbine a hotspot belongs to. This is covered in more depth in this breakdown of how drone data analytics is applied specifically to renewable energy operations, which walks through how raw flight data gets converted into asset-level reporting operators can plug into existing maintenance workflows.
This analytics layer is really the difference between "we flew a drone over the site" and "we now have a defect trend line for every turbine in the fleet." The former is a novelty. The latter changes how maintenance budgets get allocated.
Solar, Wind, and Hydro: Inspection Priorities Are not Interchangeable
It is tempting to treat "renewable energy inspection" as a single service, but the priorities shift considerably depending on the asset class, and a provider that does not account for that ends up delivering generic data that is hard to act on.
For solar, the priority is thermal consistency across panel rows and connection points. The defects that matter most hotspots, string failures, junction box faults are thermal signatures first and visual damage second, which is why thermal-first flight-planning matters more here than almost anywhere else in renewable inspection does. This is also the area with the clearest technical benchmark: aerial thermography workflows for PV assets are increasingly assessed against IEC 62446-3, the international standard covering outdoor infrared thermography of photovoltaic modules, which specifies the irradiance conditions, flight parameters, and defect classification thresholds a report needs to meet to be considered technically defensible rather than just visually informative.
For wind, the priority flips toward high-resolution visual inspection of blade surfaces, since erosion, cracking, and lightning-strike damage are primarily structural and visual rather than thermal. Findings are typically graded against leading-edge erosion severity scales commonly referencing DNV's erosion classification framework so that damage gets logged on a consistent 1-to-7-style severity scale rather than described subjectively from inspection to inspection. Flight planning also has to account for turbine rotation, meaning inspections are typically done with the turbine either stopped or moving at reduced speed, which requires coordination with site operations teams.
For hydropower and transmission infrastructure, the challenge is less about sensor type and more about access. These assets often sit in terrain that is genuinely dangerous to reach on foot steep embankments, spillways, transmission corridors through dense vegetation which is where aerial data collection provides value simply by removing the human safety exposure from the equation, independent of what sensor is mounted on the aircraft.
Understanding these distinctions matters when evaluating a provider, because a one-size-fits-all inspection package is usually a sign that the flight planning has not been tailored to the asset class in the first place.
The Numbers That Matter to Operators
Renewable energy is a margin business, and every efficiency gain compounds across a project's 20-to-25-year lifespan. A few figures explain why aerial inspection has moved from pilot programs to standard practice:
- Even a small amount of undetected soiling or micro cracking across a utility-scale solar array can translate into meaningful annual revenue loss when compounded across thousands of panels.
- Manual rope-access wind turbine inspections typically require turbine downtime for the duration of the inspection; aerial inspection can often be performed with the turbine still operating or with minimal downtime.
- Early detection of blade erosion or delamination is dramatically cheaper to remediate than a failure that requires a full blade replacement or crane mobilization.
- Faster inspection cycles mean operators can move from annual or biannual inspection schedules toward more frequent, condition-based monitoring, catching degradation trends instead of point-in-time snapshots.
None of this requires a leap of faith. It is the same logic that drove drone adoption in construction and infrastructure inspection, applied to a sector where asset uptime is directly tied to revenue in a way few other industries can match.
ESG Reporting Is Becoming a Second Use Case
There is a secondary benefit operators are increasingly leaning on: documentation. Renewable energy projects are under growing pressure to demonstrate environmental performance and operational integrity to investors, regulators, and increasingly, insurers. Aerial data geotagged, timestamped, and archived provides an auditable record of asset condition over time that is far more defensible than periodic manual logs.
This matters for ESG reporting specifically because it shifts the conversation from "we believe our assets are well-maintained" to "here is dated aerial evidence of inspection frequency and condition across the entire fleet." For funds and operators managing renewable portfolios at scale, that distinction has real weight when it comes to due diligence and reporting cycles.
What to Look for in a Drone Inspection Partner
Not every drone operator is equipped for renewable energy work, and the gap between a general aerial photography vendor and a renewable-energy-focused inspection provider shows up fast once a project is underway. A few things worth checking before signing on:
Sensor capability matched to the asset:
Solar inspection without thermal imaging is incomplete. Wind blade inspection without high-zoom optics misses the fine cracking that matters most.
A real data pipeline, not just raw footage:
Ask what the deliverable actually looks like is it a folder of images, or a structured report with flagged anomalies tied to asset IDs and GPS coordinates?
Familiarity with utility-scale site logistics:
Large solar and wind sites often involve coordination with site operators, airspace considerations, and safety protocols that a general commercial drone pilot may not be equipped to navigate.
Regulatory and airspace knowledge:
Many renewable sites sit near or within controlled airspace, particularly those close to airports or military installations, and a provider needs to understand FAA compliance for these operations, not learn it on the job.
A track record with recurring inspection programs:
Not just one-off flights since the real value shows up in trend data across multiple inspection cycles, not a single snapshot.
Where This Is Heading
The next phase of aerial inspection in renewable energy is not about better cameras sensor technology has largely matured. It is about automation and integration. Expect to see more autonomous drone-in-a-box systems performing scheduled flights without a pilot on-site, tighter integration between aerial defect data and CMMS (computerized maintenance management systems), and AI-driven anomaly detection that flags issues in near real-time rather than after a batch review.
For an industry built on long asset lifespans and thin operating margins, that shift toward continuous, automated monitoring isn't a luxury upgrade. It is becoming table stakes for how utility-scale renewable portfolios will be managed within the next few years.
Frequently Asked Questions
How often should solar and wind assets be inspected with drones?
Most utility-scale operators run quarterly or biannual aerial inspections at minimum, with high-value or aging assets monitored monthly. The right frequency depends on asset age, environmental exposure, and whether the site has a documented history of recurring defects.
Can drones replace manual inspections entirely?
No, but they replace most of them. Drones now handle routine and condition-monitoring inspections at scale, while manual or rope-access inspection is reserved for confirmed defects that need hands-on assessment, repair, or closer physical verification.
What is the typical turnaround time for an aerial inspection report?
Most providers deliver processed reports including thermal anomaly flags, defect logs, and severity classifications within 24 to 72 hours of the flight, depending on site size, sensor type, and the depth of analysis requested.
Do drone inspections work for offshore wind assets?
Yes, offshore inspections require weather-resistant equipment and vessel-based launch logistics rather than land-based flights, but the same thermal, RGB, and erosion-classification methods used onshore apply once the aircraft is airborne.
Is drone inspection data useful for insurance and financing purposes?
Increasingly, yes. Geotagged, timestamped aerial records create a documented condition history that insurers and lenders now request during underwriting and portfolio due diligence, since it is harder to dispute than periodic manual inspection logs.























Sign in to leave a comment.