1. Introduction
In the stock market, traders rely on various indicators to understand price movements and market sentiment. These indicators help in identifying trends, potential reversals, and better entry-exit points. Among these tools, the pcr ratio is one of the most widely used sentiment indicators in options trading.
The Put Call Ratio (PCR) helps traders understand whether the market is overly bullish or bearish. It is especially useful for spotting market reversal signals, where the trend may change direction.
For intraday traders, options traders, and retail investors, understanding PCR can improve decision-making and reduce emotional trading.
2. What Is Put Call Ratio (PCR)?
The put call ratio meaning is simple—it measures the ratio of traded Put options to Call options in the market.
Formula:
PCR = Put Volume ÷ Call Volume
Simple Explanation:
- If more puts are being traded → traders expect market to fall
- If more calls are being traded → traders expect market to rise
The pcr ratio is a reflection of market positioning and sentiment rather than a direct price predictor.
3. How PCR Reflects Market Sentiment
PCR acts as a trader sentiment indicator and gives insights into how market participants are positioned.
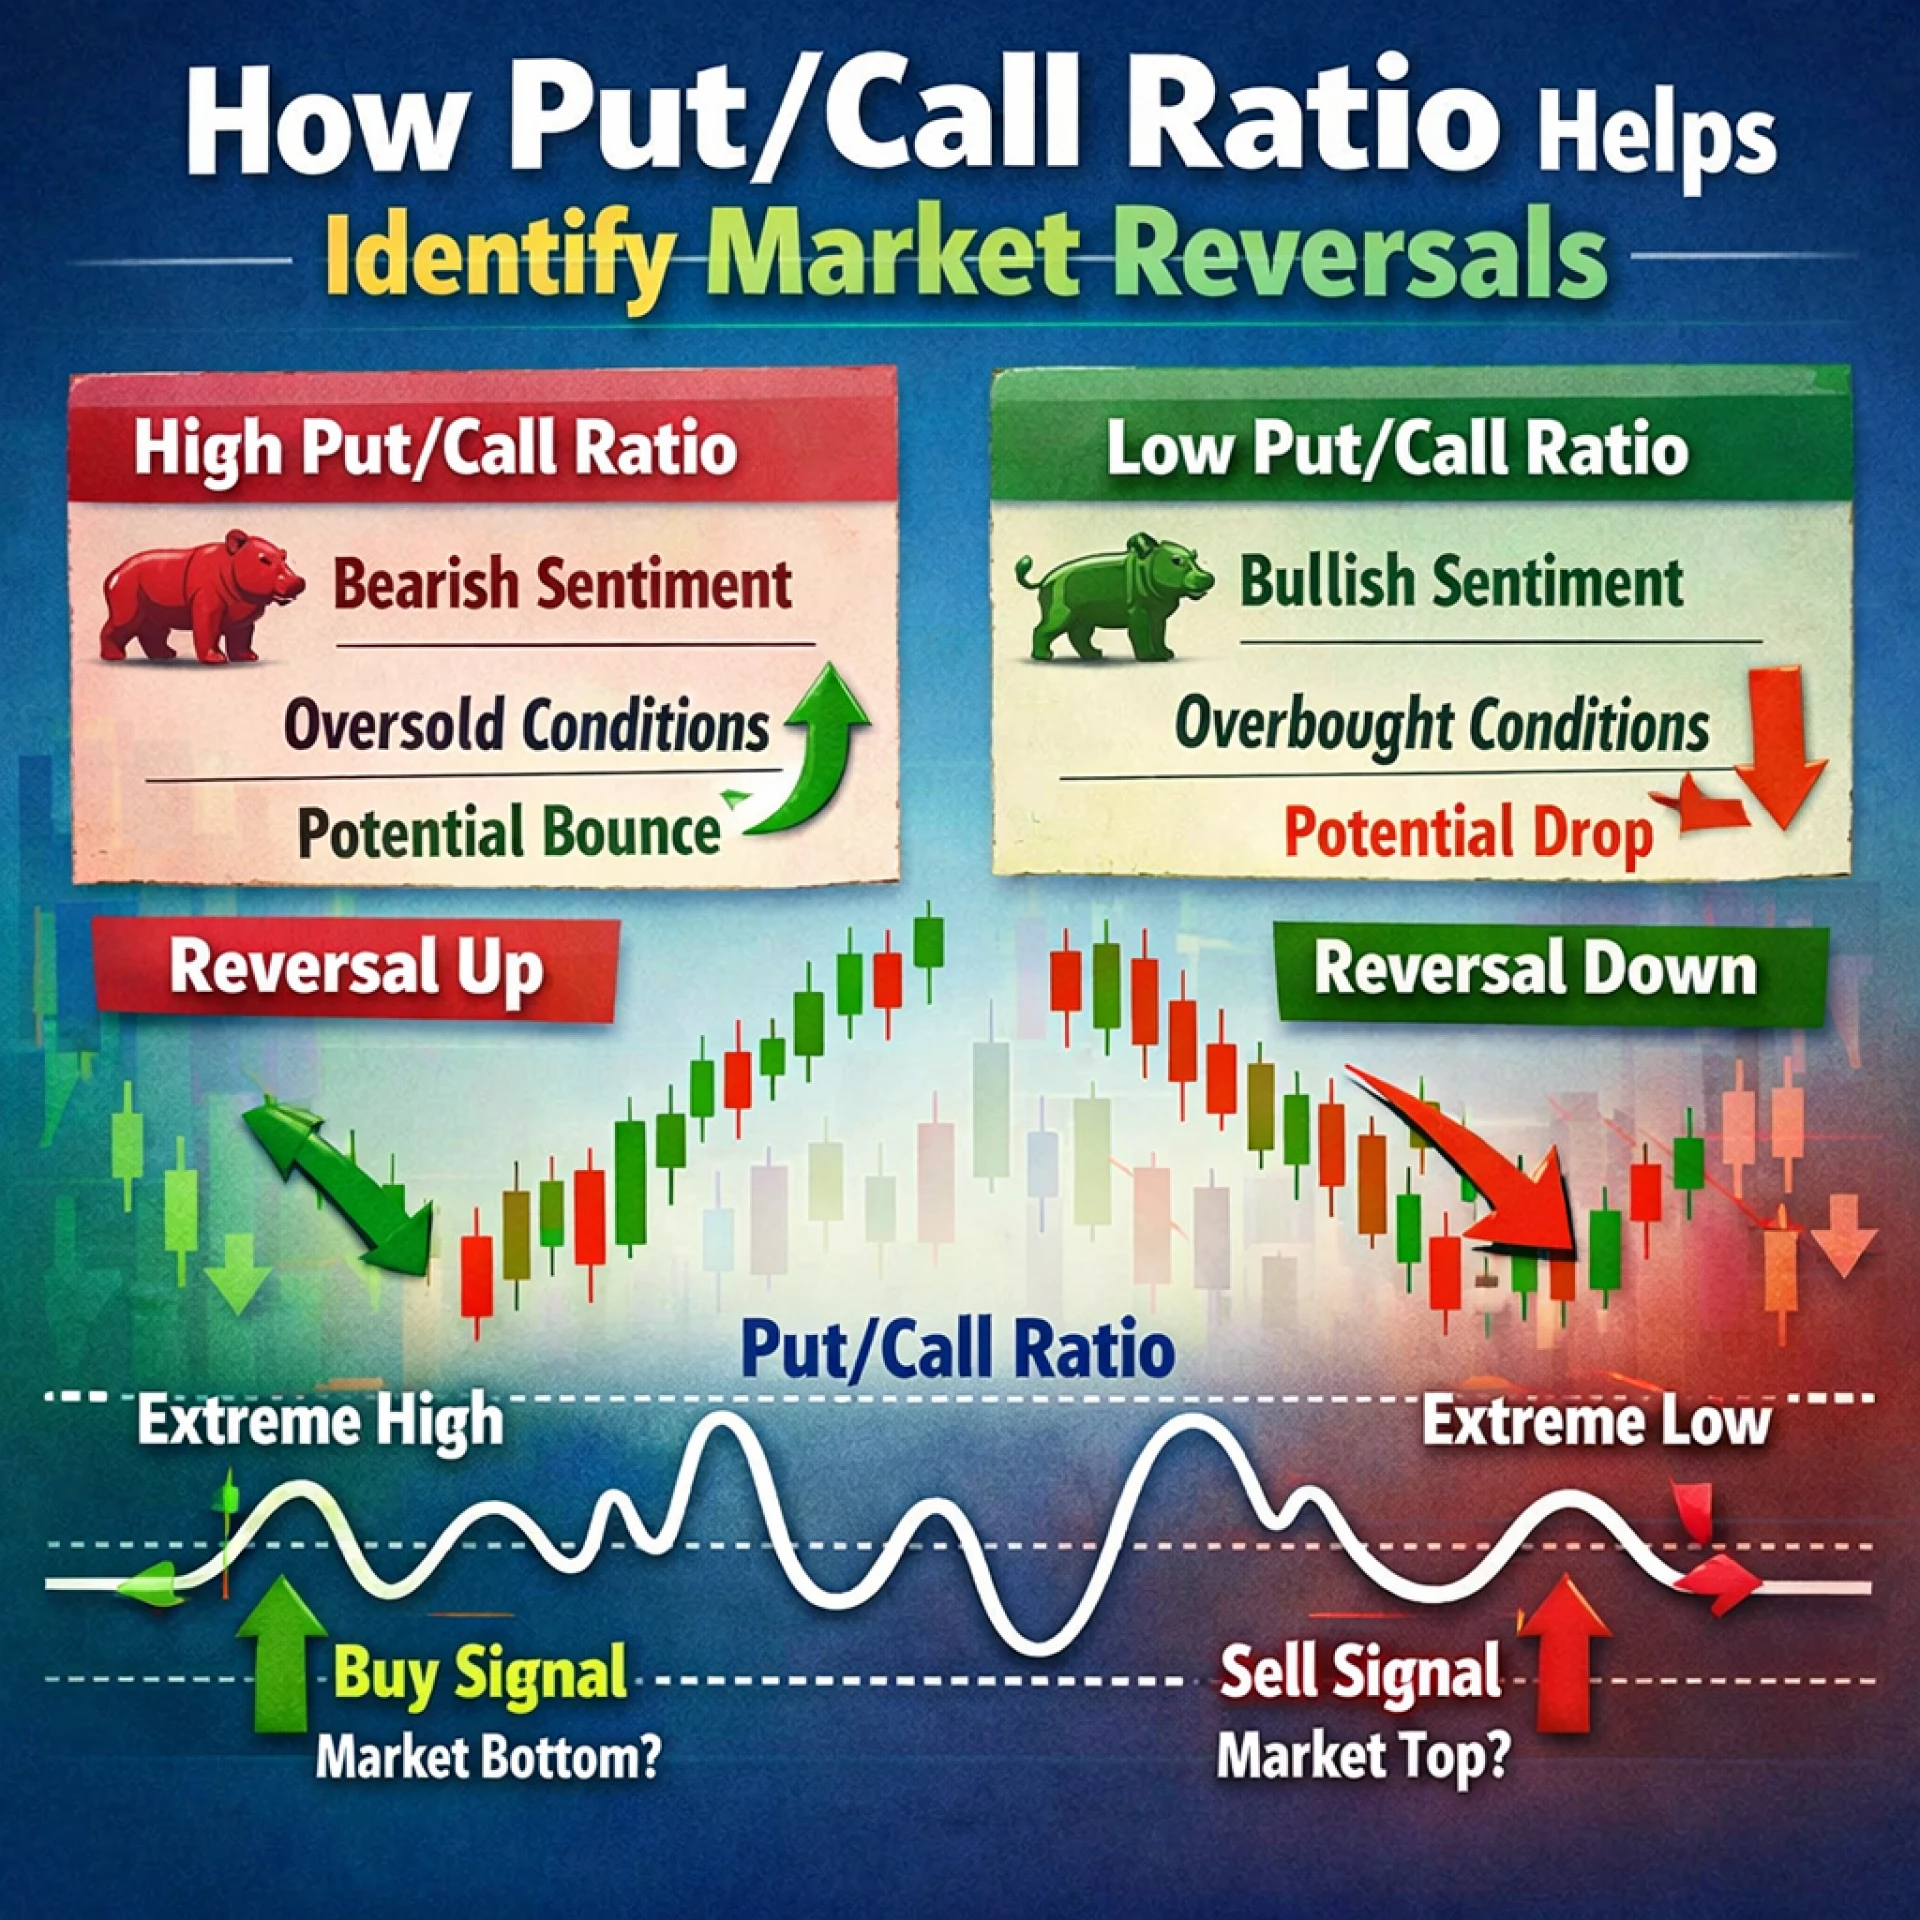
High PCR (Above 1)
- More Put buying
- Indicates bearish sentiment
- Traders are expecting downside
Low PCR (Below 1)
- More Call buying
- Indicates bullish sentiment
- Traders expect upside
Neutral PCR (Around 0.7–1)
- Balanced market sentiment
- No strong directional bias
PCR is widely used among bullish vs bearish indicators because it reflects real money positions in the options market.
4. How PCR Helps Identify Market Reversals
One of the most powerful uses of PCR is identifying market reversal signals.
Contrarian Concept
PCR works best as a contrarian indicator:
- When everyone is bearish → market may rise
- When everyone is bullish → market may fall
Extreme Levels
Very High PCR (e.g., 1.5+)
- Excessive fear in the market
- Indicates oversold condition
- Possible bullish reversal
Very Low PCR (e.g., 0.5 or below)
- Excessive optimism
- Indicates overbought condition
- Possible bearish reversal
This is why experienced traders don’t follow PCR blindly—they interpret extremes to identify turning points.
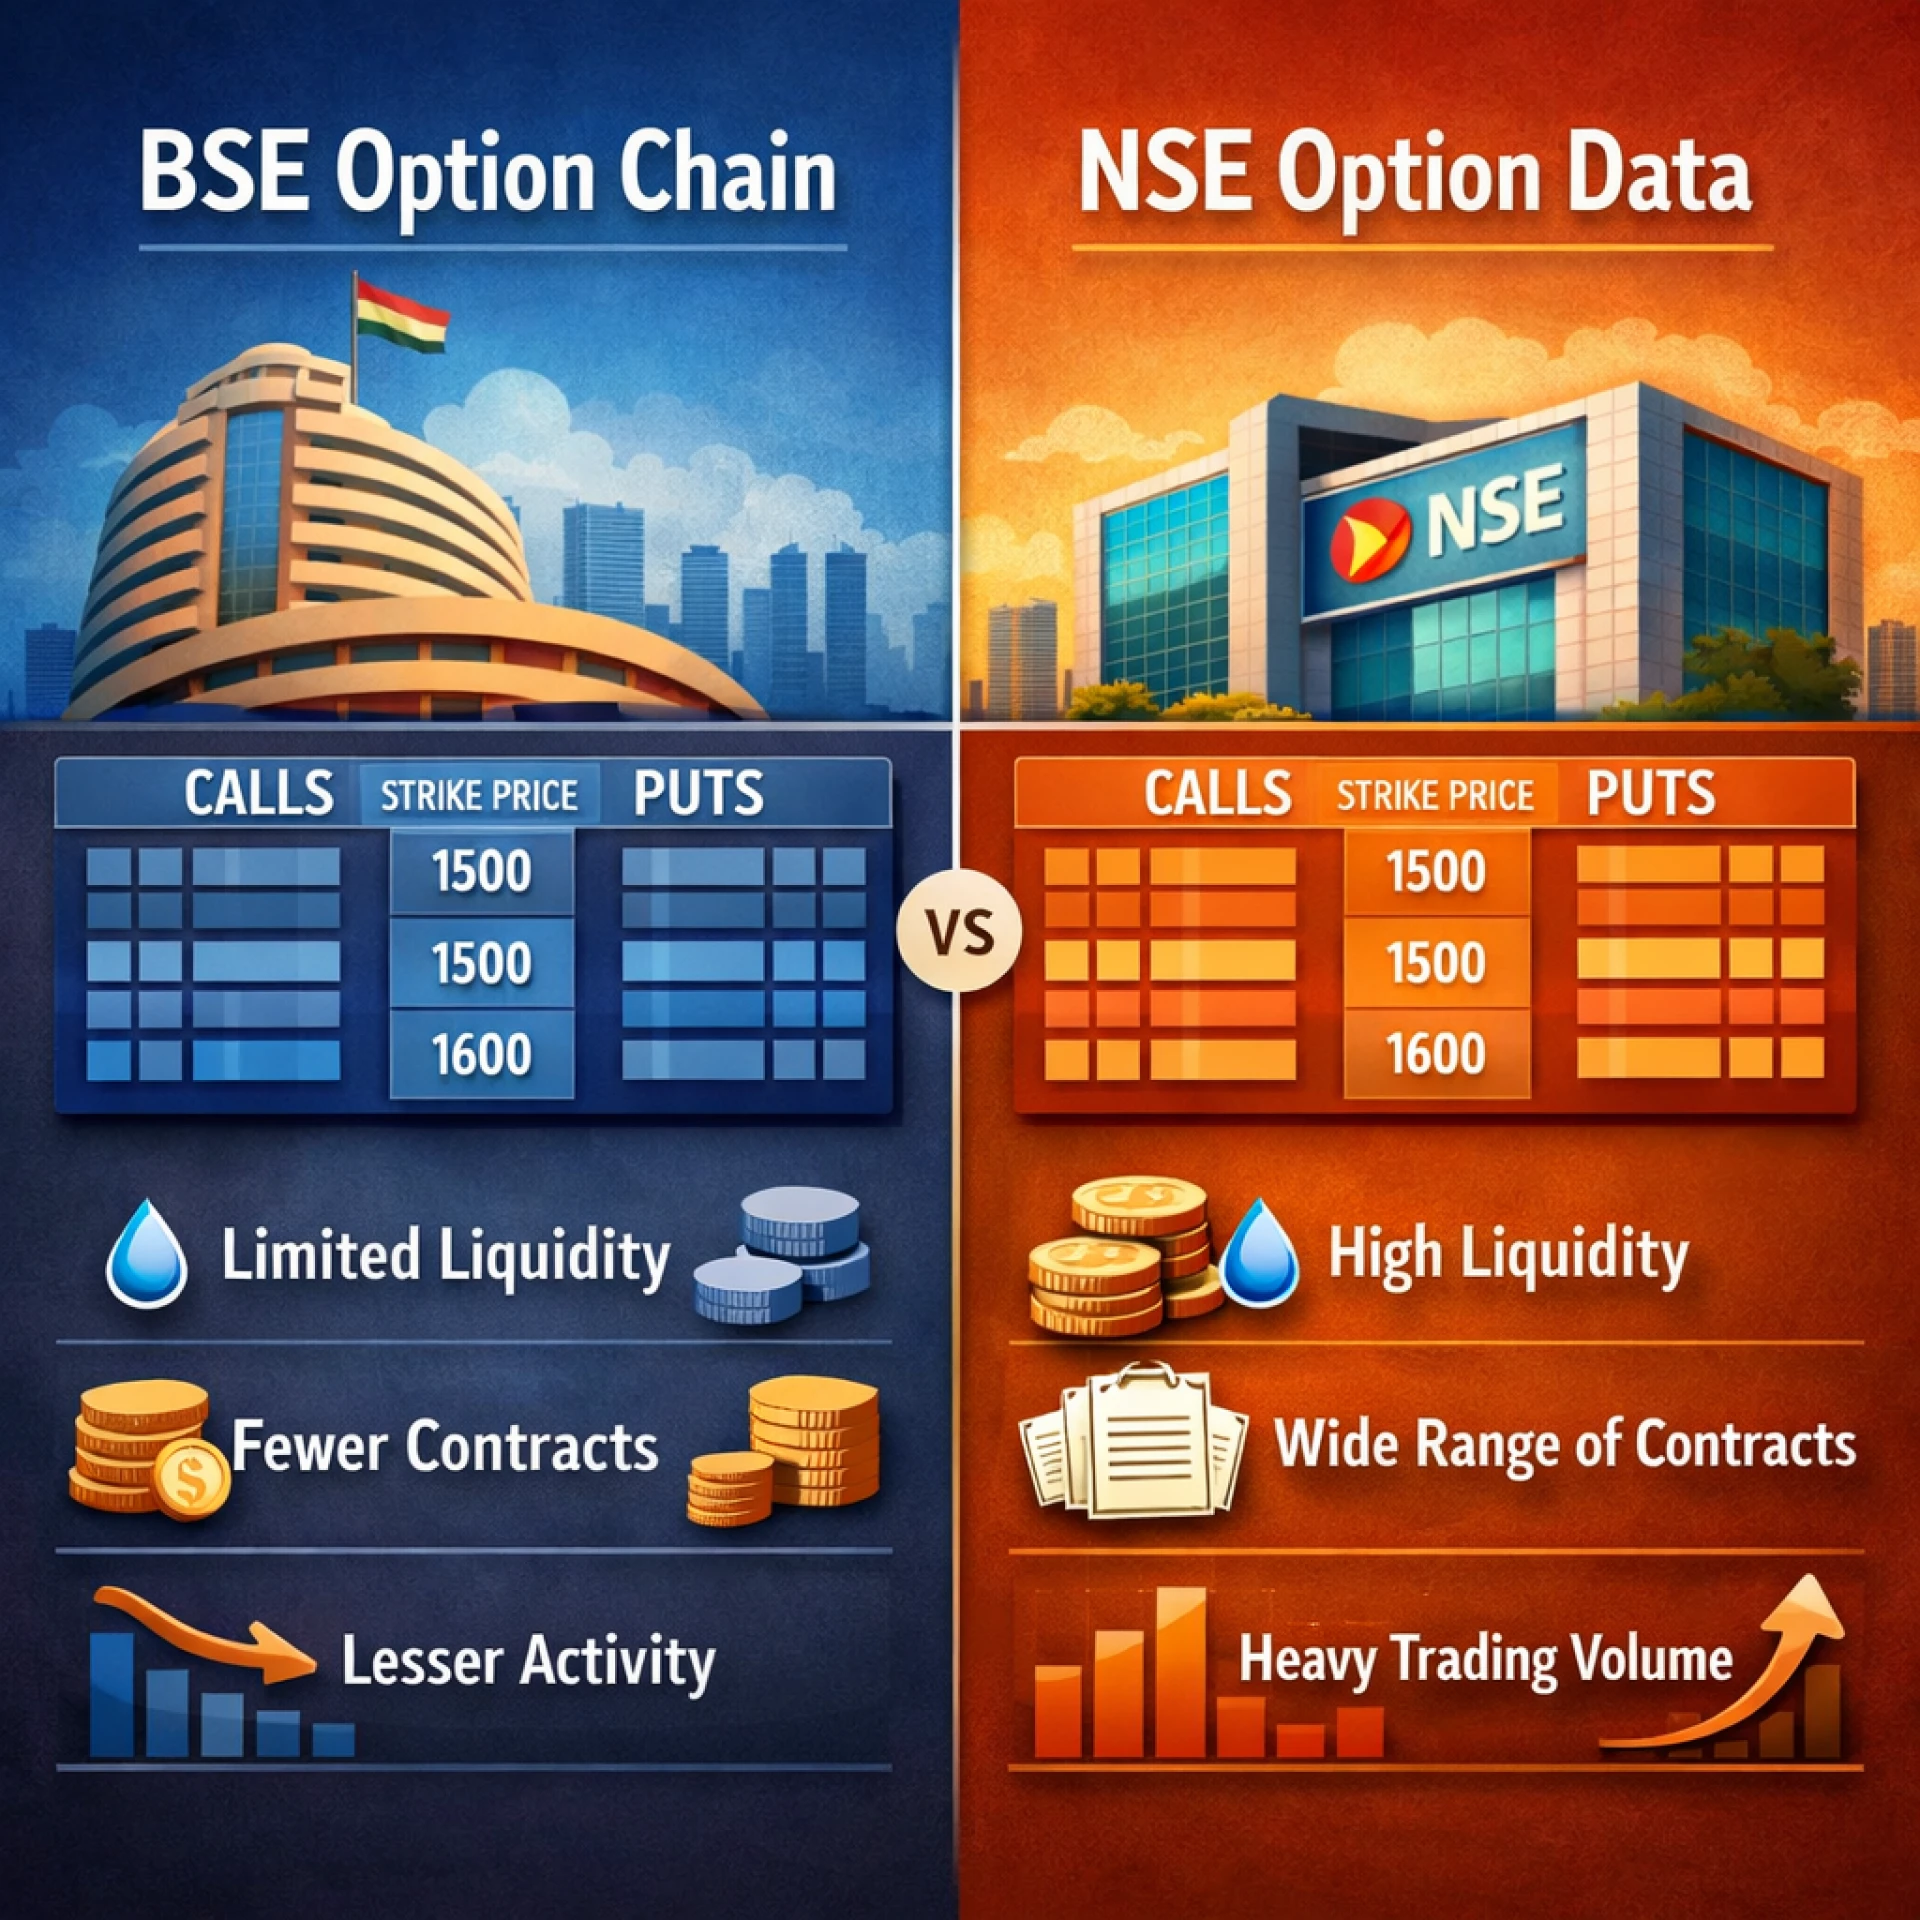
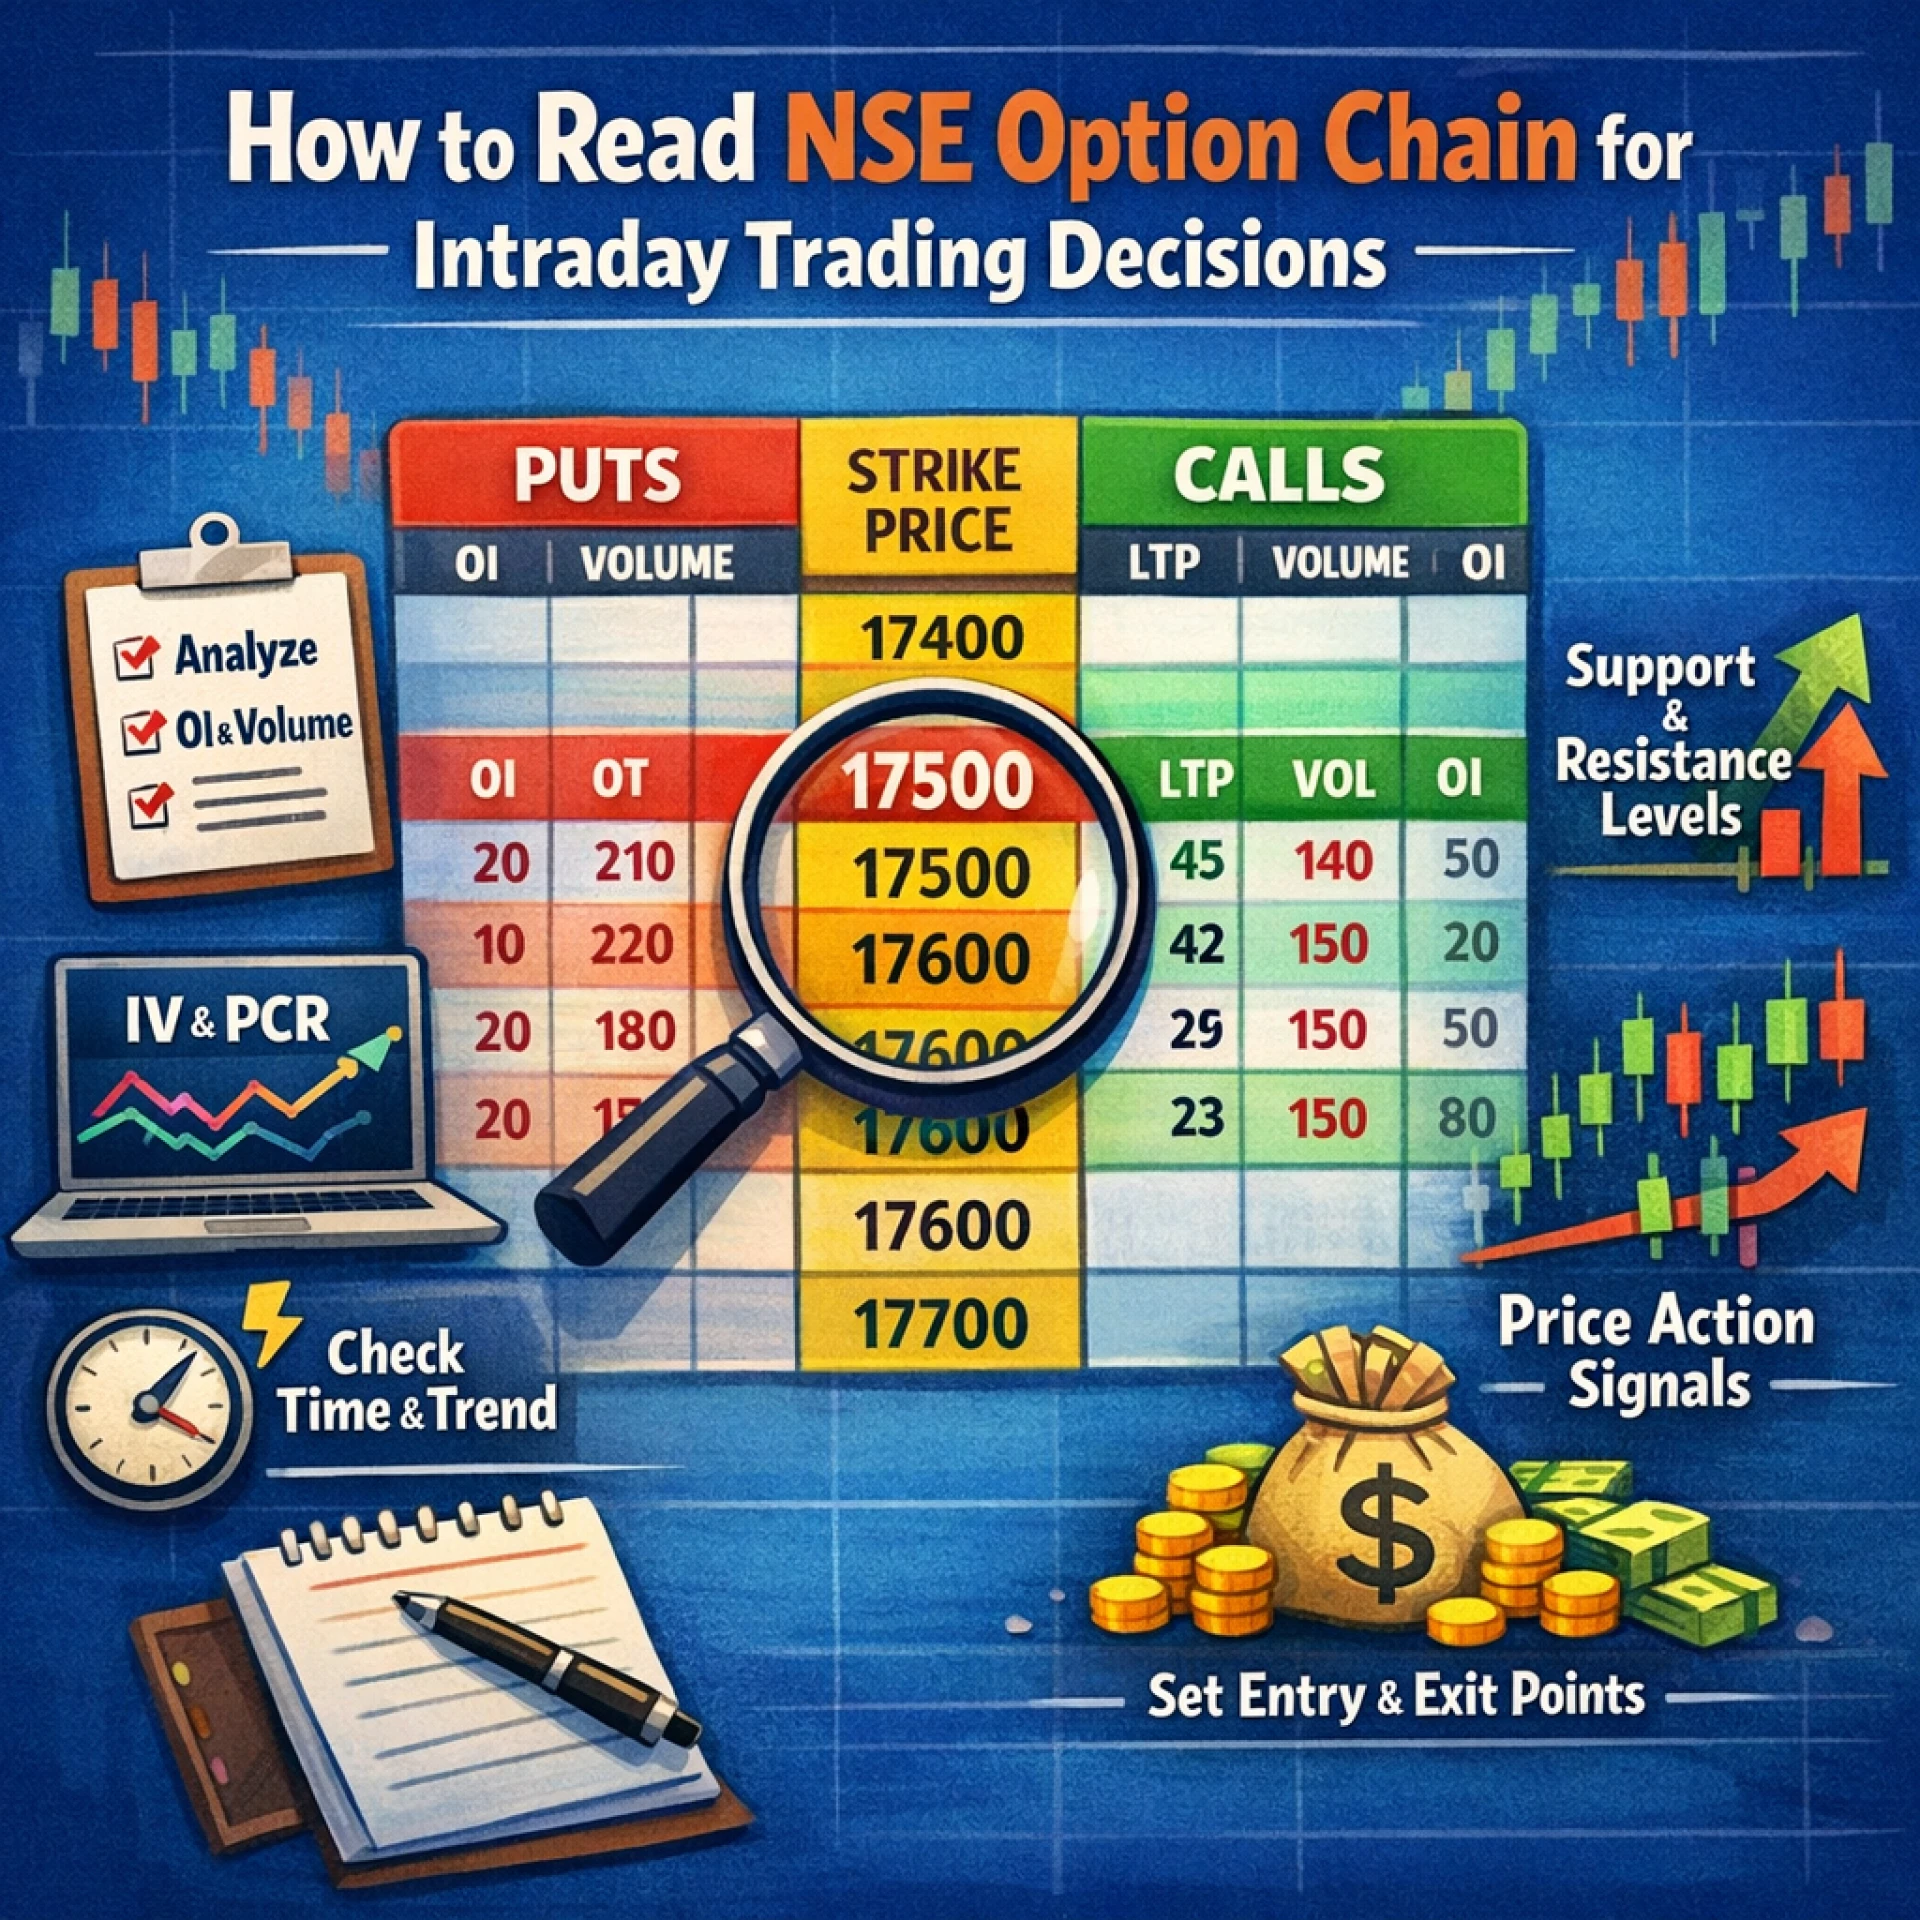
5. Using Option Chain Data with PCR
PCR becomes more powerful when combined with option chain analysis.
By studying the sensex option chain, traders can identify:
Support Levels
- High Put Open Interest
- Indicates strong support zones
Resistance Levels
- High Call Open Interest
- Indicates strong resistance
Market Positioning
- Where big players are placing bets
- Helps confirm PCR signals
Using option chain analysis India, traders combine PCR with Open Interest data to get a clearer view of stock market reversal patterns.
6. Combining PCR with Other Indicators
PCR alone is not enough. Smart traders combine it with other indicators for confirmation.
Key Combinations:
1. Price Action
- Check if price supports PCR signal
- Example: High PCR + price near support = stronger reversal signal
2. Volume Analysis
- Rising volume confirms trend strength
3. Moving Averages
- Helps identify trend direction
4. Sentiment Comparison
Traders also compare PCR with broader sentiment tools like ipo gmp live, which shows market expectations for upcoming IPOs.
Why This Matters
- If PCR shows fear but IPO sentiment is strong → mixed signals
- Helps avoid false trades
This combination improves accuracy of intraday trading indicators.
7. Practical Trading Example
Let’s understand with a simple example:
Scenario:
- PCR = 1.6 (Very High)
- Market falling for last 2 days
- Strong support seen in option chain
Interpretation:
- Market is overly bearish
- Selling pressure may be exhausted
Possible Trade Idea:
- Look for buying opportunity near support
- Wait for confirmation (price stability or reversal candle)
Important:
This is not a guaranteed signal—just a probability-based approach.
8. Limitations of PCR
While PCR is useful, it has some limitations:
False Signals
- PCR can stay high/low for long periods
Extreme Readings Confusion
- Not every extreme leads to reversal
Market Manipulation
- Big players can influence options data
Lack of Context
- PCR alone doesn’t show trend strength
That’s why PCR should always be used with other tools.
9. Common Mistakes Traders Make
Using PCR Alone
Ignoring other indicators leads to poor decisions
Ignoring Trend
PCR reversal signals fail in strong trends
Overtrading
Reacting to every PCR change
Misinterpreting Levels
Not understanding what “high” or “low” means in context
Avoiding these mistakes can improve trading discipline.
10. Market Outlook
With the rise of derivatives trading in India, tools like PCR are becoming more important.
Key Trends:
- Increasing use of Nifty option chain data
- Growing retail participation
- More focus on sentiment-based indicators
PCR will continue to play a crucial role as a trader sentiment indicator, especially when combined with data-driven strategies.
11. FAQ Section
1. What is pcr ratio in stock market?
The pcr ratio measures the ratio of Put options to Call options traded and helps identify market sentiment.
2. What is ideal PCR level?
A PCR around 0.7 to 1 is considered neutral. Extreme levels may indicate possible reversals.
3. Can PCR predict market reversal?
PCR does not predict but helps identify market reversal signals based on sentiment extremes.
4. How to use sensex option chain with PCR?
Combine PCR with Open Interest data to identify support and resistance levels for better analysis.
5. Is PCR reliable for intraday trading?
PCR can be useful but should be combined with other intraday trading indicators for better accuracy.


Sign in to leave a comment.