Every business wants to move faster, make better decisions, and grow without wasting time or money. But many teams still depend on reports that arrive too late or data that is hard to understand. By the time they see the numbers, the moment to act has already passed.
This is where real time analytics dashboards make a big difference.
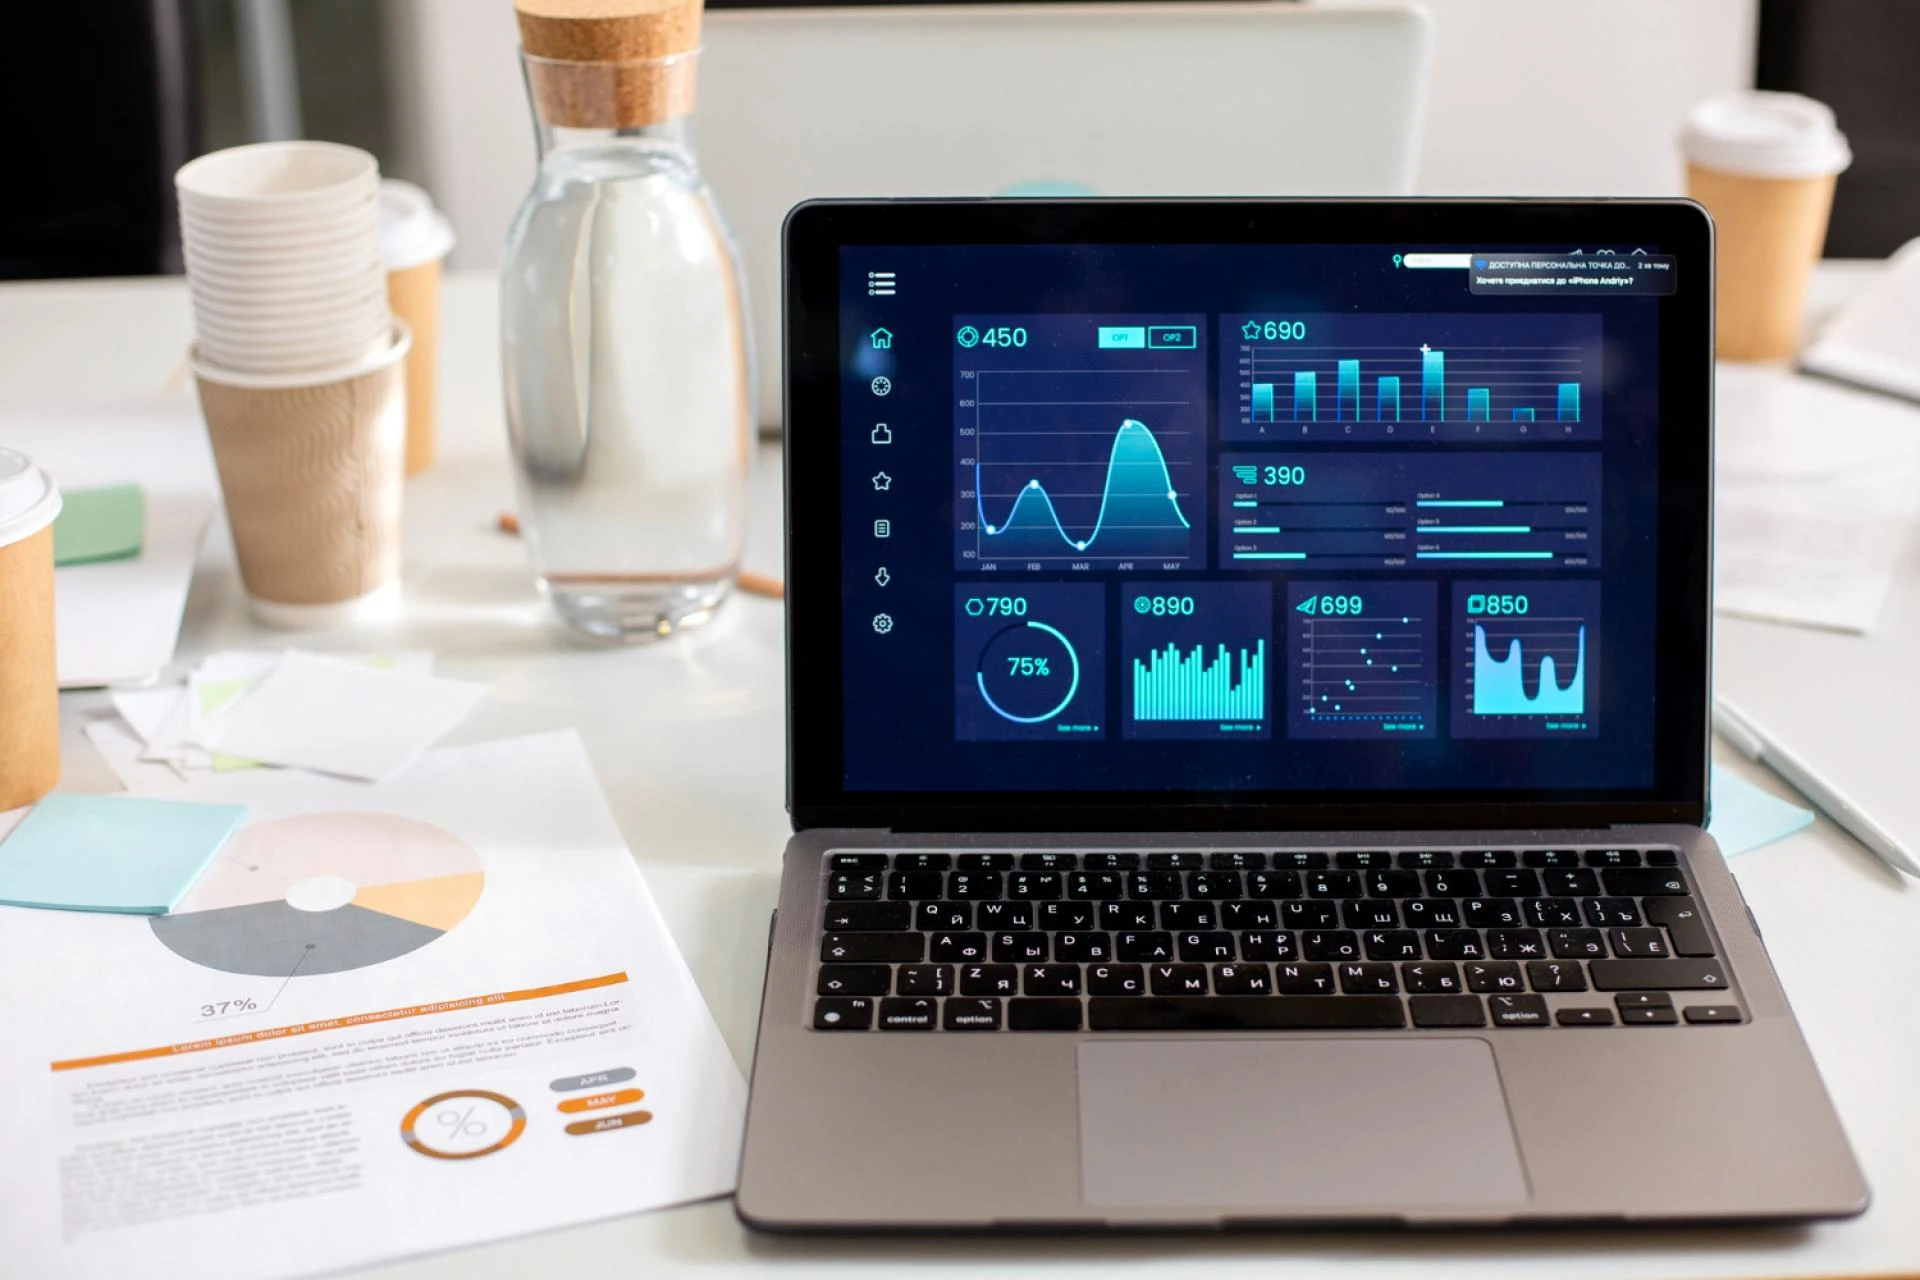
A real time dashboard shows live data in one clear place. It helps teams see what is happening right now, not yesterday or last week. When people can see the full picture instantly, they work smarter, respond quicker, and stay focused on what matters most.
In this blog, you will learn how real time analytics dashboards improve productivity and support business growth. You will also see practical examples, benefits, and tools you can use to get started.
What Is a Real Time Analytics Dashboard
A real time analytics dashboard is a visual screen that displays live data from different sources. It updates automatically as new data comes in.
Instead of reading long reports or opening many files, users see charts, numbers, and trends in one place.
Key features of a real time dashboard
- Live data updates without manual refresh
- Simple charts and graphs
- Clear performance indicators
- Data from multiple systems in one view
- Easy access for teams and leaders
These dashboards are used by small businesses, startups, and large companies across many industries.
Why Real Time Data Matters in Today’s Business World
Business moves fast. Customer needs change quickly. Markets shift without warning. Teams that rely on old data often fall behind.
Real time data helps businesses stay alert and ready.
Problems with delayed data
- Decisions are based on past events
- Issues are noticed too late
- Teams spend time fixing mistakes instead of preventing them
- Leaders guess instead of knowing
Real time dashboards solve these problems by showing what is happening as it happens.
How Real Time Analytics Dashboards Boost Productivity
Productivity improves when people know what to do and when to do it. Real time dashboards remove confusion and save time.
Clear focus for teams
Dashboards show the most important numbers first. This helps teams focus on tasks that matter now.
Examples include:
- Sales teams tracking live leads and deals
- Support teams watching open tickets
- Marketing teams checking campaign performance
When goals are visible, teams stay aligned and motivated.
Faster decision making
With live data, teams do not wait for weekly reports. They can act immediately.
Benefits include:
- Quick response to problems
- Faster approvals
- Less time spent in meetings
- More confident decisions
Less manual work
Many teams waste hours collecting data from different tools. Real time dashboards automate this process.
This leads to:
- Fewer spreadsheets
- Less copying and pasting
- More time for meaningful work
Bonus Read: How Real-Time Dashboards Help Marketers Optimize Spend and Personalization
How Real Time Analytics Dashboards Drive Business Growth
Growth comes from smart actions taken at the right time. Real time dashboards support this by turning data into insight.
Better customer experience
When businesses see customer behavior live, they can respond faster.
Examples:
- Fixing website issues instantly
- Responding to support requests faster
- Adjusting offers based on user activity
Happy customers stay longer and recommend your business to others.
Improved sales performance
Sales teams grow revenue by acting at the right moment.
Real time dashboards help by:
- Showing hot leads instantly
- Tracking deal progress live
- Identifying sales bottlenecks early
This helps teams close more deals with less effort.
Smarter marketing efforts
Marketing works best when teams see results quickly.
Dashboards allow marketers to:
- Track clicks and conversions live
- Pause campaigns that do not perform
- Invest more in what works
This leads to better return on marketing spend.
Real Time Dashboards Across Different Teams
Real time analytics is useful for every department.
For leadership teams
Leaders use dashboards to see the big picture.
They track:
- Revenue
- Costs
- Growth trends
- Team performance
This helps them plan better and avoid surprises.
For operations teams
Operations teams monitor daily activities.
Dashboards help with:
- Process efficiency
- Supply levels
- Delivery timelines
- System performance
Issues are solved before they become major problems.
For finance teams
Finance teams need accurate data.
Real time dashboards support:
- Cash flow tracking
- Expense monitoring
- Budget control
- Financial forecasting
This improves financial health and stability.
Key Benefits of Real Time Analytics Dashboards
Here are the main advantages in simple terms.
- Instant access to important data
- Faster and better decisions
- Higher team productivity
- Reduced errors and delays
- Stronger customer relationships
- Improved business growth
These benefits compound over time as teams learn to use data effectively.
Best Practices for Using Real Time Dashboards
To get the most value, dashboards must be designed and used correctly.
Keep it simple
Avoid showing too much information.
Focus on:
- Key metrics only
- Clear visuals
- Easy to read numbers
Simple dashboards are used more often.
Align dashboards with goals
Every dashboard should support a clear goal.
Ask questions like:
- What decision will this data help?
- Who will use this dashboard?
- What action should follow?
Update and review regularly
Business needs change. Dashboards should change too.
Review them often to:
- Remove unused metrics
- Add new insights
- Improve clarity
Tools That Help Build Real Time Analytics Dashboards
There are many tools available that make real time analytics easy, even for non technical users.
Popular real time analytics tools
- Lumenn AI
Lumenn AI helps businesses turn raw data into clear dashboards. It focuses on ease of use and fast insights, making it suitable for teams that want quick results without complexity. - Google Looker Studio
A free tool that connects with many Google products and data sources. - Power BI
A popular choice for businesses that use Microsoft tools. - Tableau
Known for strong visual reports and deep data analysis. - Databox
Useful for tracking performance across marketing, sales, and finance.
Each tool has its strengths. The best choice depends on your business size, goals, and data sources.
Common Mistakes to Avoid
Even good tools can fail if used poorly.
Avoid these mistakes:
- Tracking too many metrics
- Ignoring user feedback
- Using unclear labels or charts
- Not training teams properly
A dashboard should help people, not confuse them.
The Future of Real Time Analytics Dashboards
As technology improves, real time analytics will become even more important.
Future trends include:
- More automation
- Smarter insights powered by AI
- Better mobile access
- Personalized dashboards for each role
Businesses that adopt these tools early will have a strong advantage.
Conclusion
Real time analytics dashboards are no longer a luxury. They are a necessity for businesses that want to stay competitive.
By showing live data in a clear and simple way, dashboards help teams work better, make faster decisions, and grow with confidence. They reduce wasted effort and turn information into action.
Whether you run a small business or manage a large team, investing in real time analytics can transform how you work every day.
Start simple, choose the right tools, and focus on what truly matters. The results will follow.


Sign in to leave a comment.