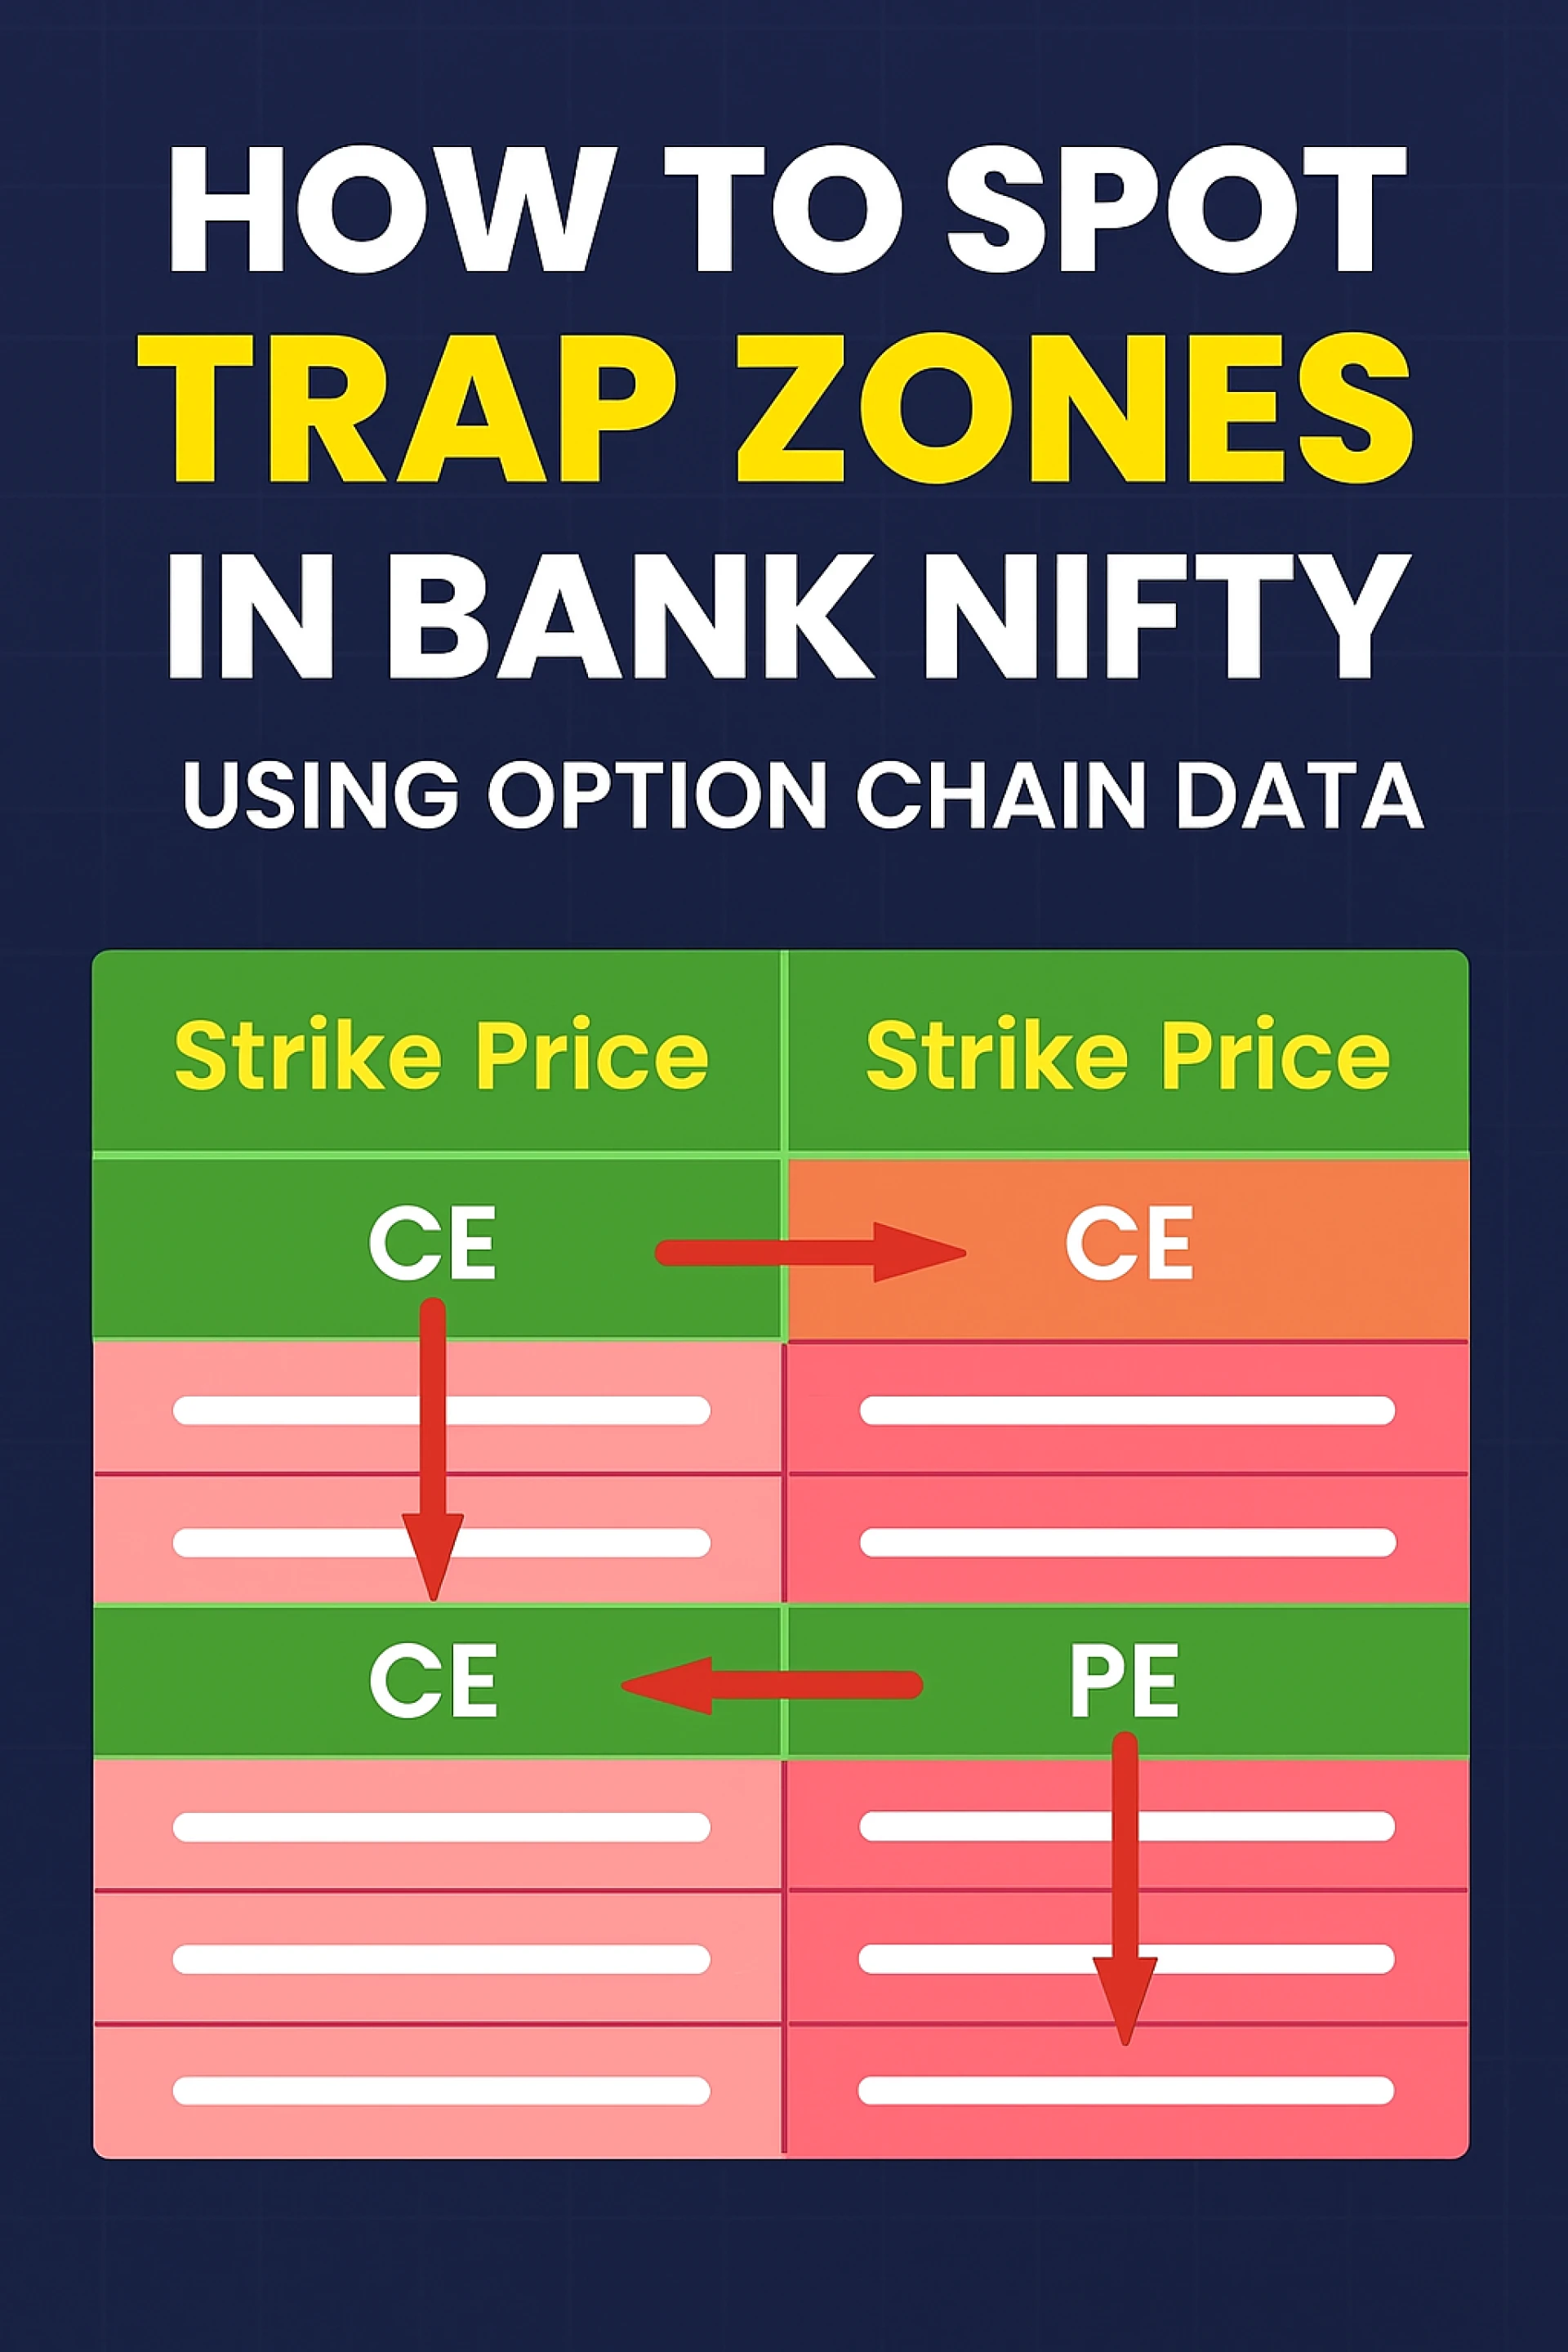
Understanding how to Spot Trap Zones in Bank Nifty Using Option Chain Data is essential for intraday traders who rely on early price movements and option flow. Trap zones form when the price appears to break out or break down, but the move quickly reverses due to heavy option writers defending their positions. These zones often catch retail traders on the wrong side of the market. Using option chain data smartly makes it easier to identify these traps before entering trades.
1. High OI Clusters Reveal Where Option Writers Are Active
The first step toward spotting trap zones is analysing Open Interest (OI) clusters. High OI levels on specific strike prices show where option writers are heavily positioned. These levels often act as barriers where the price gets pushed back.
For example, if a particular strike has unusually high Call OI, writers may defend it strongly, creating a potential reversal zone. Observing how OI shifts during the trading session provides clarity on where traps may form.
Many traders also take guidance from a Bank Nifty tips provider who highlights major OI levels before the market opens, helping traders anticipate likely reversal areas.
2. Sudden OI Addition During Breakouts Signals a Possible Trap
When the price moves toward a breakout zone, watching OI changes becomes even more important. If Call OI spikes sharply during an upside breakout, it may signal that sellers are creating a trap by adding more positions to push the price down.
Similarly, a rise in Put OI during a downside breakout suggests that downside momentum may reverse soon.
Traders who want deeper insight into this behaviour can refer to How to Read Option Chain Data for Bank Nifty Intraday Moves, which explains how these OI patterns reflect market sentiment.
3. Price Rejection Near Max Pain Levels Often Creates Trap Zones
Max Pain represents the price level at which most option buyers experience losses and most writers benefit.
Bank Nifty frequently gravitates toward this level as institutional writers attempt to manage their risk.
If price tries to move away from Max Pain but repeatedly reverses, it signals a trap zone formed by writers defending their positions.
Understanding Max Pain behaviour helps traders avoid entering trades at levels where reversals are commonly seen.
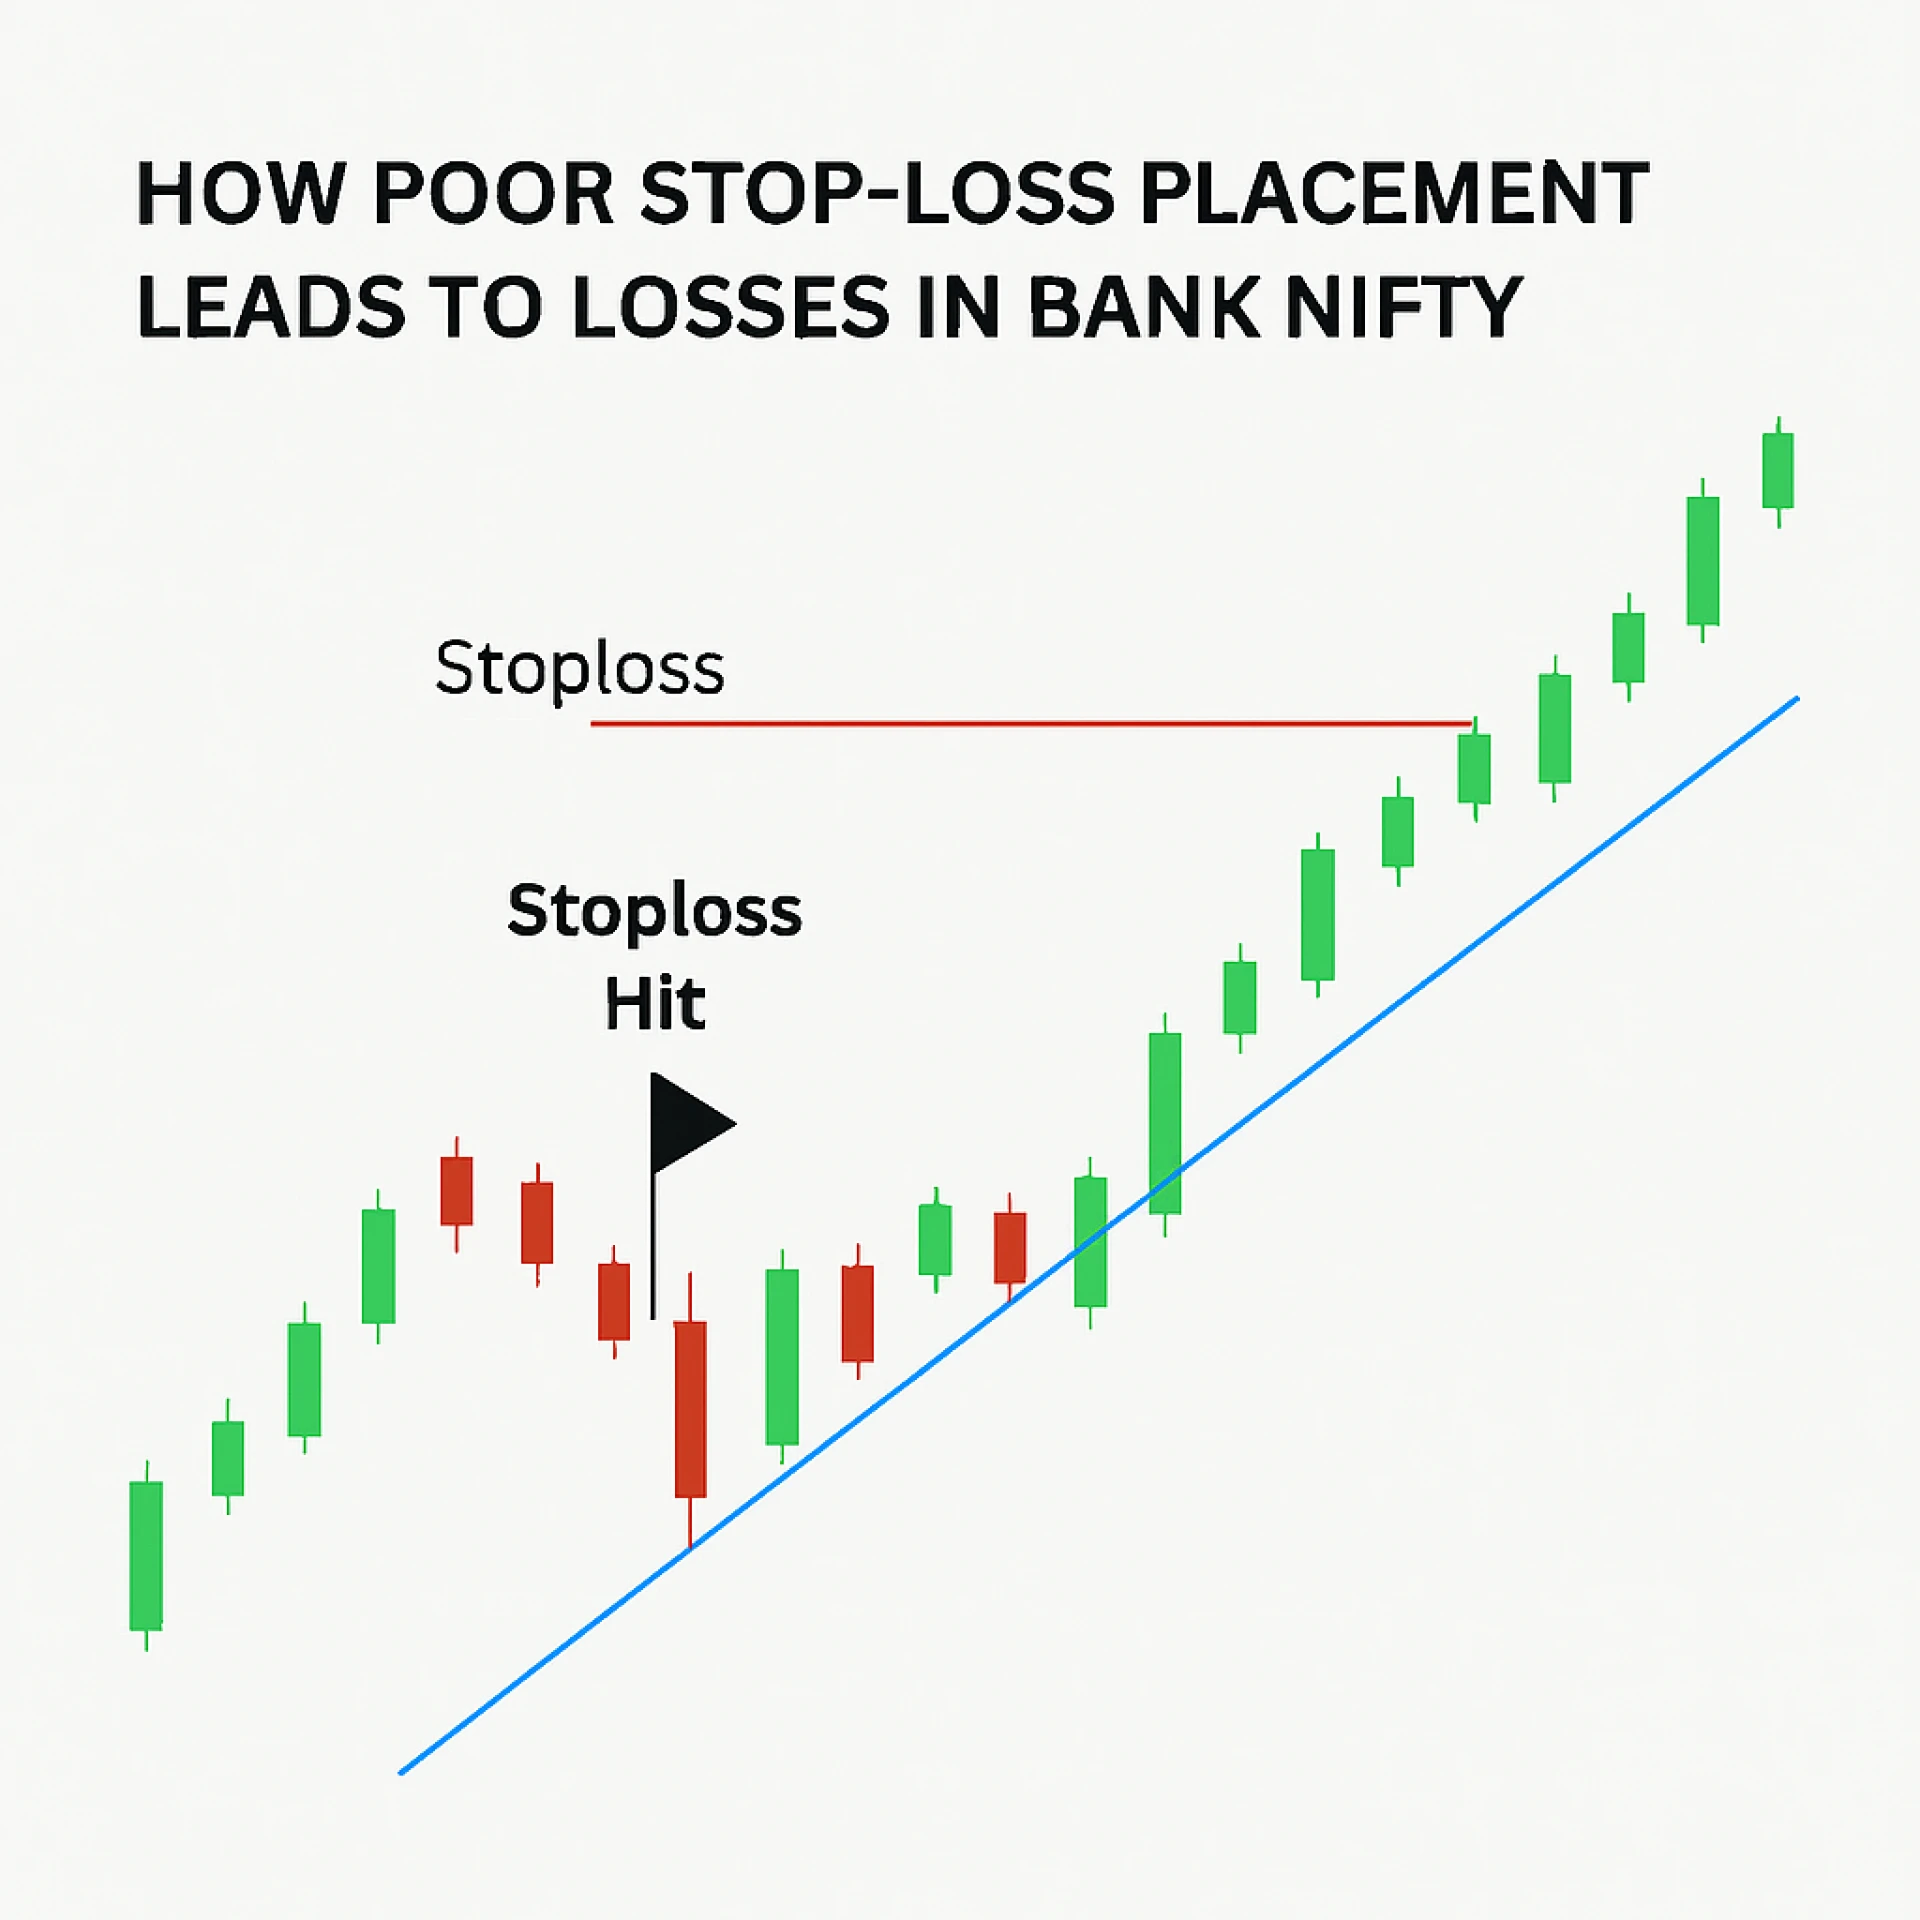
4. Identifying Writers’ Defense Zones Helps Avoid Premature Entries
Trap zones also appear near levels where institutions defend their existing option positions. A sudden increase in OI combined with sharp reversals indicates that writers are actively protecting a price zone.
If the price reaches such a level and gets rejected multiple times, it suggests that buyers or sellers may be getting trapped.
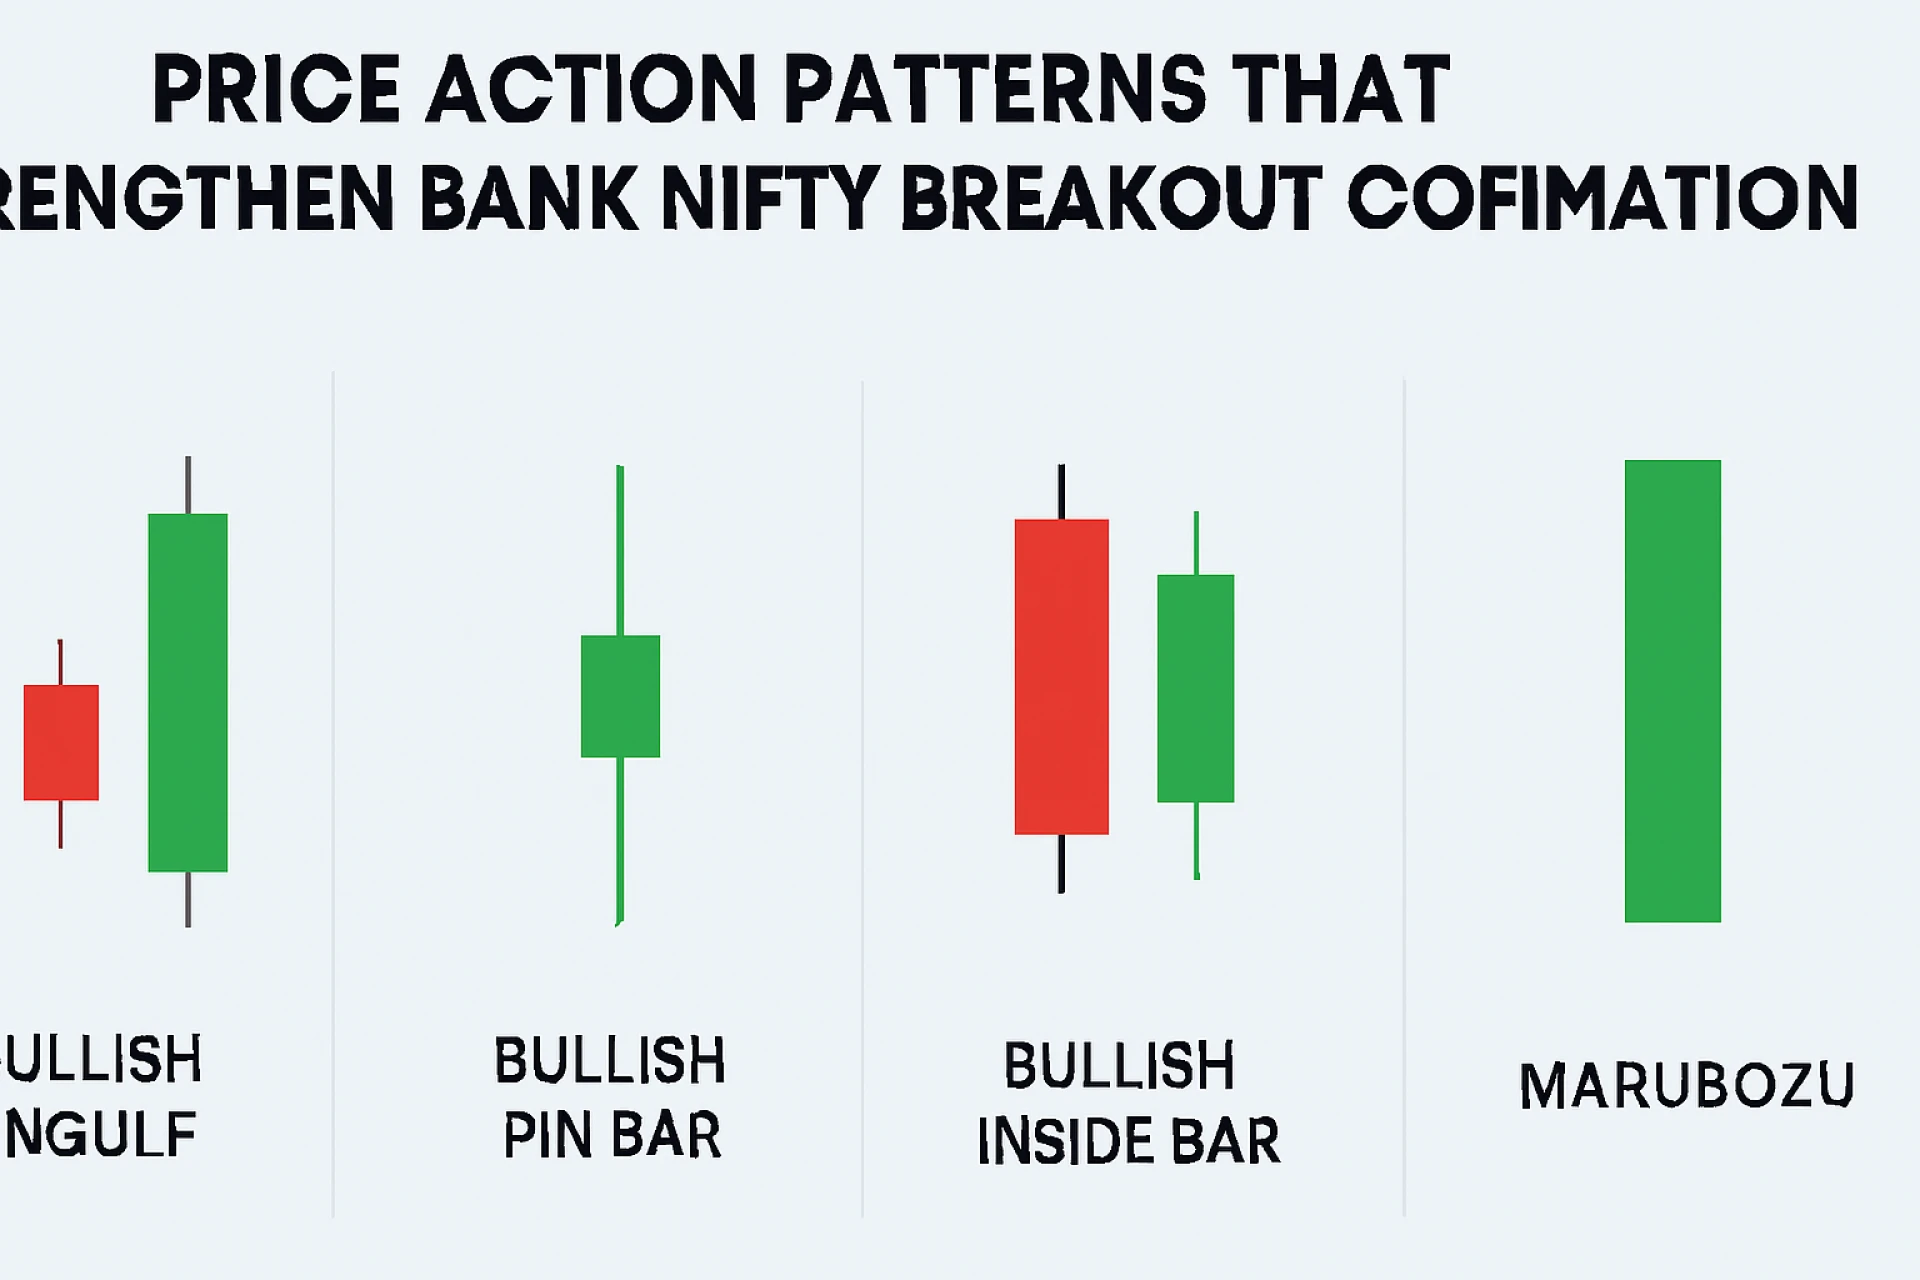
Observing repeated wicks, failed attempts to break through a strike, or sudden volume spikes provides additional confirmation of these defense zones.
5. Imbalance Between Call and Put OI Creates Directional Traps
A clear imbalance between Call and Put OI often leads to misleading movements. For instance:
- If Call OI is much higher, upside moves may struggle and turn into traps.
- If Put OI is significantly higher, downside moves may get absorbed and reverse from lower levels.
By analysing these imbalances, traders understand whether a breakout has genuine strength or if it is likely to trap inexperienced traders.
6. Rapid OI Liquidation Warns of Reversal-Based Traps
When a large group of option writers begins to exit their positions, it can trigger a sudden shift in direction.
Rapid OI unwinding near crucial price zones signals that the earlier move may have been a trap, and a new direction is forming.
This behaviour is especially relevant during volatile hours like the first 30 minutes or around major news releases.
Conclusion
Trap zones are a common challenge for intraday traders, but option chain analysis makes them easier to recognise and avoid. By studying high OI clusters, sudden OI additions, Max Pain influence, defense zones, and OI imbalances, traders gain deeper insight into where reversals may occur. Understanding How to Spot Trap Zones in Bank Nifty Using Option Chain Data helps create a more structured trading approach and reduces emotionally driven entries during false moves.


Sign in to leave a comment.