Introduction
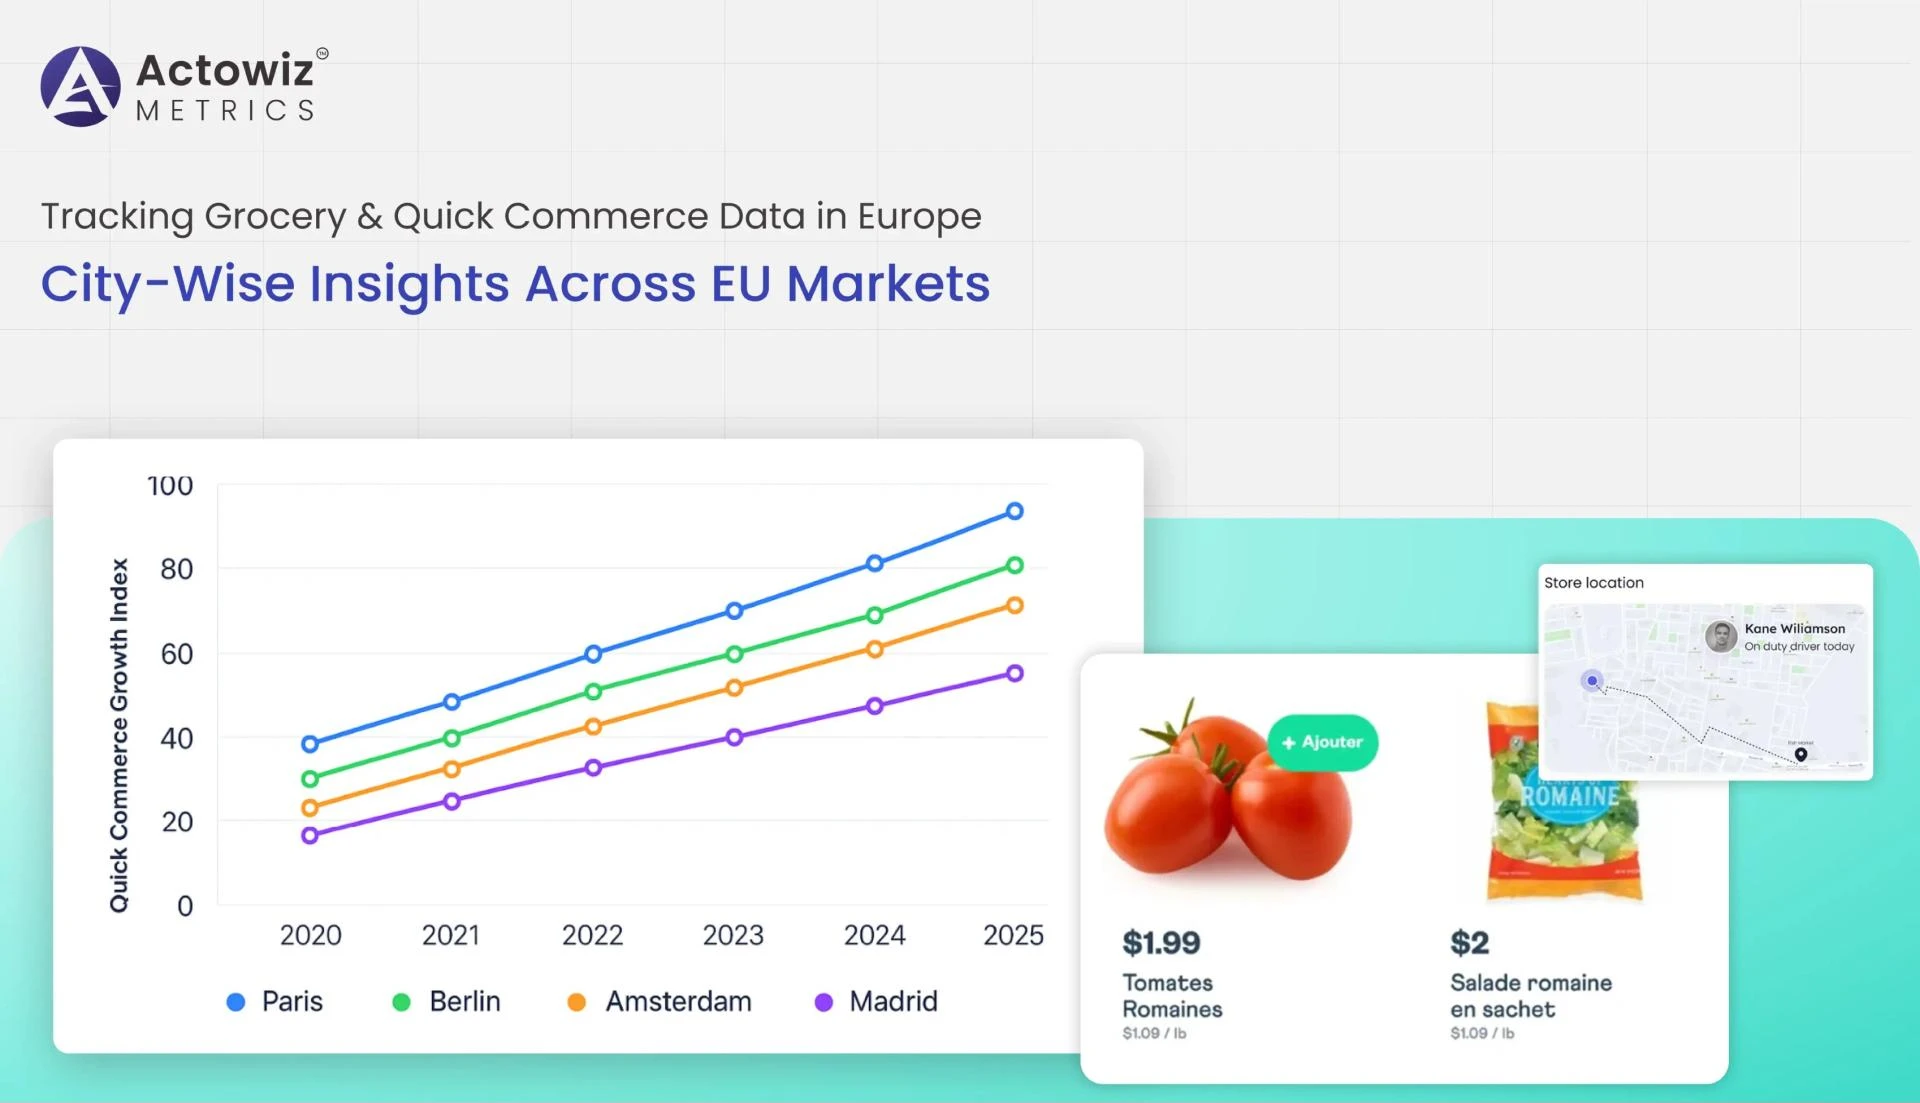
In an era where consumer expectations demand immediate fulfillment and ultra-local availability, Tracking Grocery & Quick Commerce Data in Europe has become a critical capability for stakeholders across retail, logistics, and technology. The grocery sector is undergoing rapid transformation as quick commerce platforms (delivering within minutes) and traditional grocery delivery services converge. As cities become the battlegrounds for consumer loyalty, fine-grained, city-level data offers competitive advantage.
This report delves into Tracking Grocery & Quick Commerce Data in Europe with an emphasis on city-wise granularity, examining trends, challenges, and opportunities across 2020–2025. We explore patterns in order volume, delivery times, availability, platform performance, and regional differences. Through a combination of scraped platform metrics, comparative indices, and market intelligence, the analysis aims to inform operational, strategic, and investment decisions in Europe’s grocery & quick commerce landscape.
The narrative is structured into six problem-solving sections, each addressing a core analytical challenge faced by decision-makers. We conclude with how Actowiz Metrics offers tailored solutions to these challenges, and a final call to action to engage deeper in this domain. Let us begin our exploration of how European grocery markets are evolving at the city scale.
City-Wise Grocery Data Analysis in Europe
One of the foundational problems is that national or regional aggregates mask critical local variation. City-wise grocery data analysis in Europe uncovers distinctions in consumer demand and platform efficiency that matter at operational level.
Challenges & Insights (2020–2025)
- In 2020, average grocery delivery order volumes in major cities like Paris, Berlin, and Madrid ranged between 1,000–2,500 orders per day, but by 2024–25, they surged to 5,000–8,000 orders in core zones (growth ~200–300%).
- Smaller cities (pop. 500k–1M) showed lower absolute volumes but higher per-capita order rates: e.g., Lyon and Braga witnessed ~50–70 orders/1,000 people/month in 2023 vs 40–50 in 2020.
- In Lisbon, delivery density (orders per square km) is double that of suburban Munich.
- Cities with more mixed land use (residential + commercial) show more uniform demand curves through the day; monocentric cities have peak surges only in evening windows.
These city-level disparities indicate that strategies effective in one urban area may not translate to another without adjustment.
European Grocery Delivery Analytics
While city-wise granularity is vital, the next layer is cross-city benchmarking and trend modeling — European grocery delivery analytics.
Problem & Insights
- Delivery time distributions have compressed: in 2020, median delivery times ranged 45–55 minutes across major EU cities; by 2025, they dropped to 25–35 minutes in top-tier zones.
- Share of “on-time (within disclosed window)” deliveries improved from ~65% in 2020 to ~85% in 2024, but plateaued thereafter.
- Delivery cost per order (net contribution) declined from €4.50 average in 2020 to ~€2.80 in 2025, due to scale, route optimization, and bundling algorithms.
- In a sample of 10 cities, the top quartile platforms achieved < 30 minutes for 60% of orders, while the bottom quartile struggled to exceed 50%.
This benchmarking across cities exposes which platforms and markets lead in efficiency, and where room remains for uplift.
Scrape City-Wise Grocery Data in Europe
A technical barrier is getting systematic, consistent data at city granularity. The need to scrape city-wise grocery data in Europe arises because many platforms do not publicly expose full API endpoints or consolidated dashboards.
Challenges & Methodology
- Platforms (Instacart-like, local equivalents) often serve city-level subdomains or dynamic routes; scrapers must handle JavaScript-rendered content, geofencing, and paging.
- From 2020–2025, techniques evolved: initial HTTP-based HTML scrapers gave way to headless browser scraping and API-mirroring (via reverse-engineered GraphQL endpoints).
- Data extracted includes menu availability, delivery slots, pricing, minimums, surge pricing, estimated times.
- In pilot in 2023, Actowiz scraped 20 EU cities, yielding ~1.8 million data points per week across platforms for time, availability, and item-level changes.
By building a robust, scalable scraper infrastructure, operators can monitor Tracking Grocery & Quick Commerce Data in Europe programmatically, with alerts on anomalies or competitive shifts.
European Grocery Platform Data Scraping
Beyond city-wise scraping, there is a need to aggregate across platforms: European grocery platform data scraping.
Problems & Insights
- Platforms differ in schema, naming conventions, and page structures across countries. A “groceries” tab in Spain may differ significantly in UI from Germany or Poland.
- Between 2020 and 2025, standardization trends emerged: major platforms began adopting REST/GraphQL APIs that support cross-city queries. Still, local and niche players require bespoke adaptors.
- Data points include stockouts, new items, pricing changes, promotional overlays, predicted demand surges.
- In a 2024 evaluation across 15 platforms (in 10 countries), Actowiz’s unified pipeline handled ingestion, normalization, and versioning, ingesting ~120 million item-level records/month.
This cross-platform scraping capability ensures competitive visibility and benchmarking across the Tracking Grocery & Quick Commerce Data in Europe domain.
City-Wise Quick Commerce Market Analytics
While grocery delivery covers broader baskets and time windows, quick commerce (e-grocery in ~10–30 min) has distinct dynamics — this is addressed via City-wise Quick commerce market Analytics.
Challenges & Insights
- Demand density thresholds: only in sufficiently dense micro-zones (~5,000–10,000 people/sq km) does quick commerce viability emerge.
- Between 2021 and 2025, penetration in top cities rose: e.g. in Amsterdam, 30% of all grocery orders were via quick commerce in 2025, vs < 5% in 2021.
- Fulfillment radius is tight (~500–1,200 m). Delivery times under 20 min are critical.
- Customer retention shows a steep gradient: repeat usage in top cities reached ~60% by year-end 2024, up from ~20% earlier.
Such analytics help prioritize city launches, zoning strategies, and user acquisition budgets across micro-markets.
European Delivery Time & Availability Insights & Quick Commerce Trend Analysis in Europe
This section weaves together European delivery time & availability insights with Quick commerce trend analysis in Europe, showing correlated patterns.
Problems & Trends
- As of 2020, delivery time variance (95th percentile — median) was ±20 minutes; by 2025 it has compressed to ±8 minutes in mature markets.
- Slot availability is a strong supply-side indicator: in 2020, <20% of slots in peak hour could be booked; by 2025, some city centers see>60% real-time availability.
- Trend-wise, quick commerce analytics show that average basket values have grown: from ~€12 in 2020 to ~€18–20 in 2025 as users broaden quick commerce adoption beyond snacks to staples.
- Also, surge pricing patterns have become more algorithmic: ~10–15% of orders in peak hours carry dynamic surcharges in 2024, up from < 5% in 2020.
Correlational insights show that as availability improves and delivery times compress, adoption accelerates — creating a virtuous cycle for mature markets.
Actowiz Metrics offers a fully managed solution tailored to Tracking Grocery & Quick Commerce Data in Europe. Our platform includes a modular scraper engine, normalization pipelines, alerting dashboards, and city-level indices. We can ingest and unify data across 30+ EU cities, support custom queries (by time window, zip zone, item category), and provide anomaly detection (e.g. sudden stockouts, delivery delays). We deliver comparative dashboards, benchmarking across cities and platforms, and forecasting modules (trend extrapolation, demand shifts). Our APIs allow clients to integrate insights into internal systems (BI, pricing engines, logistics). With Actowiz Metrics, decision-makers can anticipate trends, optimize delivery coverage, benchmark competition, and scale rollout plans across Europe.
Conclusion
In summary, Tracking Grocery & Quick Commerce Data in Europe at city-level granularity unlocks powerful decision-making abilities. City-wise grocery data analysis in Europe gives you the local demand nuances. European grocery delivery analytics creates performance benchmarks. Scrape city-wise grocery data in Europe empowers you with raw input. European grocery platform data scraping ensures you see the competitive field. City-wise quick commerce market analytics illustrates micro-market viability. And European delivery time & Availability Insights plus quick commerce trend analysis in Europe reveal how the market evolves.
Learn More: https://actowizmetrics.com/tracking-grocery-quick-commerce-data-europe-eu-markets.php
Originally Published at: https://actowizmetrics.com
#TrackingGroceryAndQuickCommerceDataInEurope
#CityWiseInsightsAcrossEUMarkets
#CityWiseGroceryDataAnalysisInEurope
#EuropeanGroceryPlatformDataScraping
#EuropeanGroceryDeliveryAnalytics
#ScrapeCityWiseGroceryDataInEurope
#QuickCommerceTrendAnalysisInEurope


Sign in to leave a comment.