

On the morning of August 18, 2026, Indian benchmark indices opened lower. The Sensex slipped past 77,450, and the Nifty 50 dropped below 24,230, weighed down by a fresh rise in crude oil prices and weak cues from Asian markets. Alongside this, India VIX, the National Stock Exchange's volatility index, moved up by roughly 2.5 percent to trade near 11.6.
For a trader glancing at a market dashboard, that single data point, "VIX up 2.5 percent," can look alarming. But context changes the story completely. At around 11.6, India VIX was sitting close to its 52-week low of 8.72 and nowhere near its 52-week high of 28.91, a level the index had touched earlier in the year during a sharper bout of market stress. In other words, volatility expectations were still historically subdued even as equity indices dipped.
This gap between the headline (a rising VIX) and the underlying picture (a VIX still near multi-month lows) is exactly where most retail traders go wrong. Understanding what India VIX measures, and what it does not, is one of the more useful pieces of market literacy an investor can build.
What India VIX Actually Measures
India VIX was introduced by the NSE in 2008, using a methodology licensed from the Chicago Board Options Exchange (CBOE), the same organization behind the original US VIX. It is calculated from the live order book of Nifty 50 options, specifically the best bid-ask quotes of near-month and next-month out-of-the-money contracts.
The number itself represents the market's expectation of annualized volatility in the Nifty 50 over the next 30 calendar days. If India VIX reads 12, the options market is pricing in an expected move of roughly plus or minus 12 percent in the Nifty over the coming year, scaled down to a 30-day window for practical use. It updates continuously through the trading session, roughly every 15 seconds, as option premiums shift.
Two things are worth underlining here. First, India VIX is derived from options prices, not from the Nifty's own price chart. It reflects what option buyers and sellers are currently willing to pay for protection or exposure, which makes it a sentiment gauge as much as a statistical one. Second, and this is the part most commonly misunderstood, India VIX has nothing to say about direction.

The Number Tells You "How Much," Not "Which Way"
This is the single most common misreading of the index. A rising VIX is often treated as a bearish signal, and a falling VIX as a bullish one. That correlation exists historically, largely because fear tends to spike during sharp declines, when traders rush to buy protective puts and push up option premiums. But India VIX is, by construction, non-directional. It measures the magnitude of expected price movement, not whether that movement will be up or down.
A market can see India VIX rise while grinding higher, particularly around events with genuine two-sided uncertainty, such as a Reserve Bank of India policy decision, a Union Budget, or an escalation in a geopolitical situation like the recent Strait of Hormuz tensions affecting crude oil supply. In each of these cases, both call and put premiums can rise together because nobody is certain which way the outcome will break, not because the market is specifically bracing for a fall.
Treating a rising VIX as an automatic sell signal, or a falling VIX as a buy signal, skips this nuance entirely.
Reading the Level, Not Just the Daily Change
The second common mistake is reacting to the percentage change in VIX rather than its absolute level. A 2.5 percent rise sounds significant in isolation. But moving from 11.33 to 11.62 is a small shift within what market participants generally consider a "calm" volatility regime.
Market convention (not a fixed rule, but a widely used rough guide) breaks India VIX into broad bands:
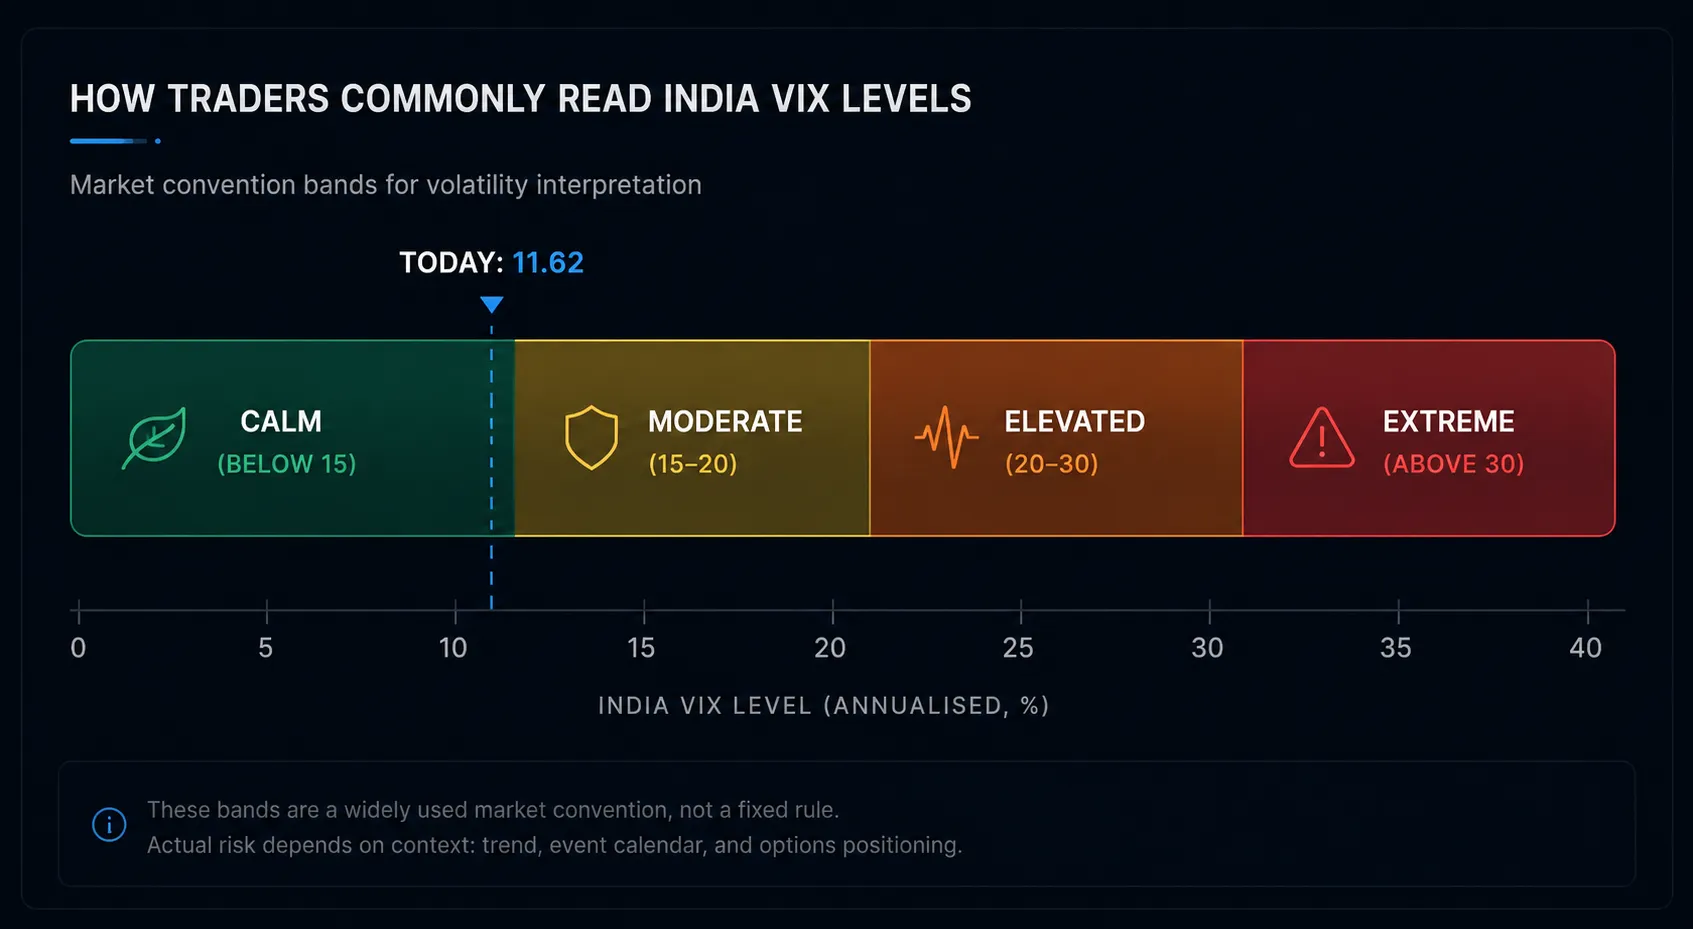
Below roughly 15, the market is typically pricing in calm, range-bound conditions. Between 15 and 20 suggests moderate uncertainty. Between 20 and 30 signals elevated caution, often coinciding with meaningful index corrections. Above 30 has historically been reserved for genuine stress events, sharp corrections, election outcomes, or global shocks.
On August 18, 2026, India VIX at 11.6 sat firmly in the calm zone despite the day's decline in the Sensex and Nifty. That is a meaningfully different situation from, say, VIX climbing from 22 to 26, even if the day-over-day percentage change looks similar on a headline basis. Reading the zone the index sits in matters more than reacting to a single day's percentage move.
Why This Distinction Matters for Traders
For anyone trading options, India VIX has direct practical use, separate from its role as a sentiment indicator. It feeds into how expensive or cheap option premiums are. When VIX is low, as it was on this particular trading day, option premiums across the board tend to be cheaper. This is often a more favorable environment for option buyers, since less is being paid for time value, while option sellers typically earn thinner premiums for the risk they take on.
When the VIX is elevated, the reverse applies. Premiums thicken, which can benefit sellers willing to accept the higher risk, while buyers pay more for the same directional exposure. Neither environment is inherently good or bad. It simply changes the cost-benefit profile of different strategies, which is why many experienced options traders check VIX before deciding whether to structure a trade as a buyer or a seller of premium.
For position sizing and risk management more broadly, the VIX level also offers a useful check. A trader running the same position size regardless of whether VIX is at 11 or 28 is effectively ignoring how much the underlying is expected to move, which can lead to outsized losses precisely when volatility is already elevated.
A More Useful Way to Use the Index
Rather than treating India VIX as a fear alarm to react to on a daily basis, it is more useful as a background gauge, checked periodically to understand the broader risk environment. A few practical habits worth building:
Look at the level relative to its recent range, not just the day's percentage change. A VIX of 12 behaves very differently depending on whether the recent range has been 9 to 15 or 20 to 30.
Cross-reference VIX with the news calendar. If VIX is elevated ahead of a known event, such as a central bank decision or major earnings, that is a structurally different situation than an unexplained spike, which may warrant closer attention.
Use VIX to calibrate expectations, not to time entries or exits on its own. It is one input among several, alongside price action, volumes, and broader macro context.
India VIX remains one of the more genuinely useful tools available to Indian market participants, precisely because it measures something price charts cannot show directly: how much uncertainty is currently priced into the options market. The value comes from reading it correctly as a gauge of expected magnitude, not a prediction of direction, and always in the context of its recent range rather than a single day's move. Building this kind of market literacy, reading volatility, options data, and price action together, is the kind of skill that comes with structured practice and patience.
Frequently Asked Questions
What is India VIX and how is it calculated?
India VIX is a volatility index that measures the market's expectation of annualized volatility in the Nifty 50 over the next 30 days. It is calculated from the live order book of Nifty 50 options, specifically the best bid-ask quotes of near-month and next-month out-of-the-money contracts.
Does a rising India VIX always indicate a bearish market?
No, a rising India VIX does not necessarily indicate a bearish market. It measures the expected magnitude of price movement, not the direction, meaning both call and put premiums can rise simultaneously due to uncertainty in the market.
How should traders interpret changes in India VIX?
Traders should look at the absolute level of India VIX rather than just its daily percentage change. For instance, a rise from 11.33 to 11.62 might be minor compared to a shift from 22 to 26, indicating different levels of market calm or stress.
Why is understanding India VIX important for options traders?
Understanding India VIX is crucial for options traders because it affects the pricing of option premiums. A low VIX generally means cheaper premiums beneficial for buyers, while a high VIX results in thicker premiums favorable for sellers.
What does it mean if India VIX is below 15?
When India VIX is below 15, it typically indicates calm, range-bound market conditions. This suggests that traders expect minimal volatility over the near term, which can influence trading strategies and risk management.
How can traders effectively use India VIX in their strategies?
Traders can use India VIX as a background gauge to assess the overall risk environment. They should consider its level relative to recent ranges, cross-reference it with upcoming news events, and use it to calibrate their expectations rather than as a sole timing tool.
What are the common misconceptions about India VIX?
A common misconception is that India VIX directly predicts market direction, with rising values viewed as bearish. However, it primarily measures expected volatility and does not indicate whether that volatility will be upward or downward.



























Sign in to leave a comment.