Statistics is a vital part of mathematics. It is a valuable tool for collecting, processing and interpreting data. Moreover, it is incredibly versatile, having various real-world applications. However, for students, it can often pose a problem. These problems can range from a lack of understanding to trouble remembering the formulae. Hence, in their struggles, they seek out guidance. There are various Statistics Assignment Help services online. These can aid a scholar with any of their problems. According to the experts of these services, a pivotal concept is a measure of central tendency. But what is it? Read the following section to know more!
Measures of Central Tendency in Statistics
You must be wondering, like many other students, “What is a measure of central tendency?”. Simply put, it refers to averages. But that is an oversimplification. In mathematics, a measure of central tendency is a single value that describes the central value or the centre of a dataset. It acts as a summary of the various data points available to us, like a representative. There are some standard measures of central tendency like mean, median and mode. We'll be having a look at them later. Let’s first know their importance.
Why are these Useful?
As emphasised above, these are central values of a dataset that act as a summary. But how are they useful? Take a look at the points below:
1. Simplification: Reduce a larger dataset into a simple representative value
2. Comparison: Allow for easy comparison between various datasets (by comparing their centres)
3. Condensation: Help condense a large amount of information into a more manageable form.
4. Representative Value: Provide a single value that aims to capture the essence of the entire dataset
5. Provide a Foundation: They serve as a basis for more advanced statistical analyses and calculation.
Thus, these were some reasons that shed some light on the importance of using measures of central tendency in mathematics and research.
Practical Example
For example, read this brief example that you can find on websites like Instant Assignment Help. If you want to find out the average height of a group of people, you can use the mean of their heights. Moreover, this single value alone can give you some idea of the typical height of individuals in that group. Taking the case of the middle value can represent the typical level of height when there are extreme values present. In addition, if you want to know the most frequently occurring value, you can find the mode of the heights.
Some Measures of Central Tendency
According to various Math Homework Help services, there are some measures of central tendency that are essential for any student to know about. The uses above might have given you an idea of why these are important, especially for a scholar. Thus, let us take a glance at some measures of central tendency.
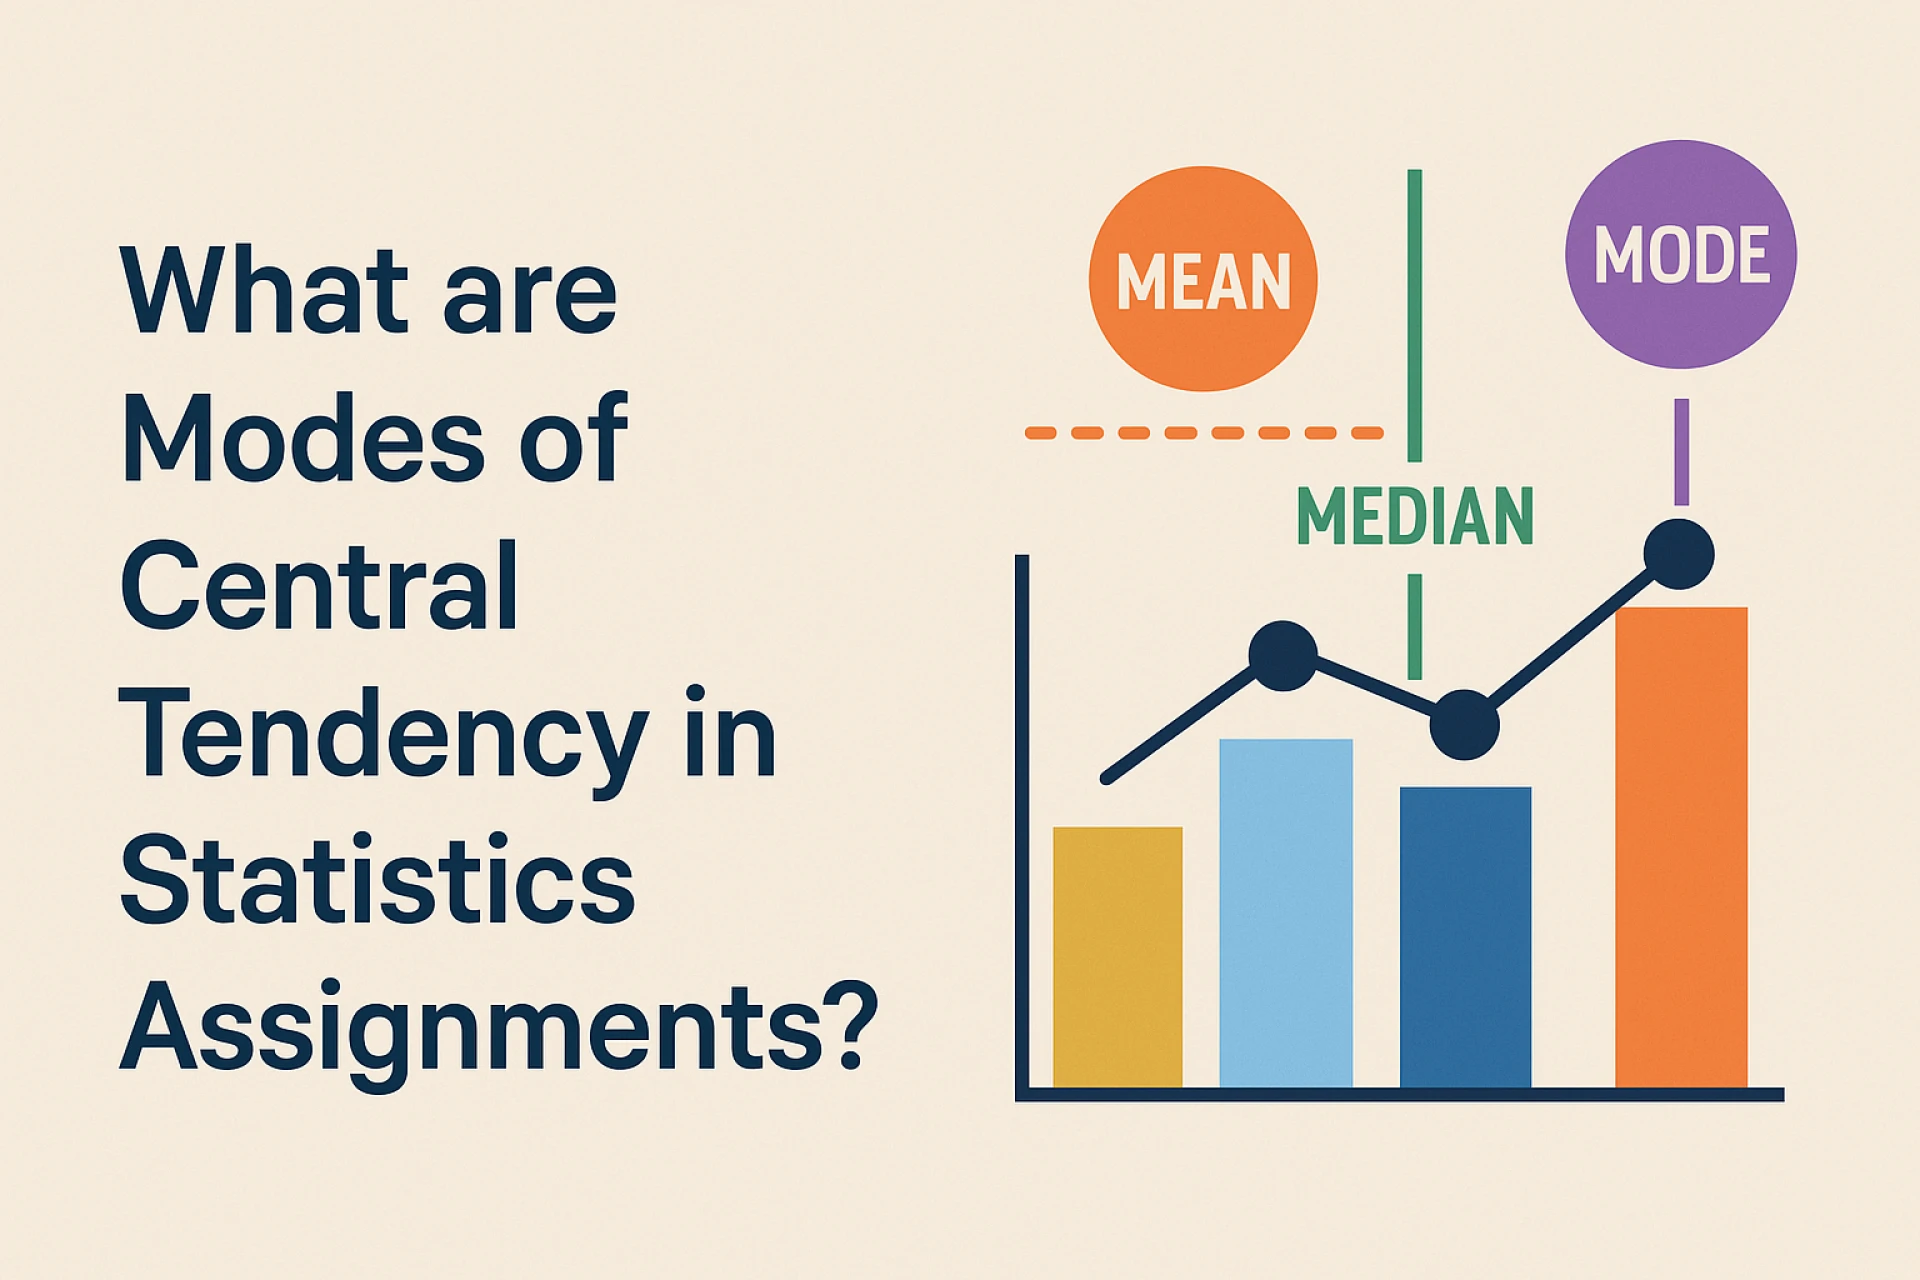
Mean
It is the average of all values in a dataset. You can easily calculate it by adding all values present and dividing them by their total number. In addition, using mean is appropriate for interval and ratio data, especially when the data is mostly symmetrical and doesn't have extremes.
Median
This mathematical value is the middle of any dataset. Moreover, to find a middle value of any dataset, arrange all values in order from the smallest to the greatest. Plus, for an even number of values, the median is the average of the two middle values. Experts suggest using this measure when the data is skewed, as it is not as sensitive to extreme values.
Mode
The simplest measure of central tendency in math. Mode is the value that appears the most frequently in any given dataset. You can use this measure of central tendency to understand the most common value. It can be used with any data, ranging from nominal, ordinal, interval and ratios.
GM and HM
Geometric Mean (GM) is useful for finding the average of a set of values when you want to find the average growth rate or average of ratios. Harmonic Mean (HM), on the other hand, is helps find the average of rates or ratios.
Trimean
This measure of central tendency combines the median, the first quartile and the third quartile. What are these terms? The first quartile is the value that separates the lowest 25% of data from the rest. The third quartile is the value that represents values below 75%.
Midmean
This value is the arithmetic mean of the values between the first and third quartiles. As discussed above, it takes the average of the two quartiles to exclude the most extreme 25% of the data on each end of the data. It completely removes the extreme values that might skew the results of the standard mean.
L-Moments
These values are linear combinations of order statistics that provide a robust estimation of both central tendency and dispersion. In addition to making it easier to work with both variables, it is beneficial for studying skewed data.
Conclusion
Summing up, in this article, we read about measures of central tendency. These are essential components of mathematical study, as many Statistics Assignment Help services might suggest. These are values that act as a central representative of an entire dataset and provide its description. We then read about what makes these worthwhile and a practical example. Then, we read about some common modes of central tendency, like mean, mode, median, GM and HM. Plus, lesser-known ones like Trimean, Midmean and L-Moments.
Also Read - How to Analyze Legal Issues In Assignments?


Sign in to leave a comment.