Cloud network monitoring is the process of observing and optimizing traffic, performance, availability, and security across cloud-based networks. This includes VPCs/VNets, load balancers, gateways, APIs, private links, hybrid connections, and SaaS traffic.
1. Define Objectives and Monitoring Scope
Before setting up tools or dashboards, decide what you need to monitor.
Common goals:
- Ensure app performance and uptime
- Track latency, packet loss, throughput
- Monitor cloud interconnects and VPNs
- Detect misconfigurations or outages
- Observe east–west and north–south traffic
Define what to include:
- Virtual networks (VPCs / VNets)
- Subnets, routing tables, gateways
- Cloud load balancers and DNS
- API gateways and edge networks
- Hybrid/SD-WAN connections
2. Map Your Cloud Architecture
Create a simple diagram of your cloud environment to identify key monitoring points.
Include:
- Regions and availability zones
- Virtual networks / subnets
- Firewalls, NAT, and routing
- Services relying on network paths
- Inter-cloud connections (e.g., AWS Transit Gateway, Azure ExpressRoute)
This ensures you know where to place probes, cloud based network monitoring logs, and alerts.
3. Enable Cloud-Native Monitoring Services
Each cloud provider gives foundational telemetry:
AWS
- VPC Flow Logs
- CloudWatch Metrics & Logs
- CloudWatch Synthetics
- CloudWatch Internet Monitor
Azure
- Network Watcher (NSG Flow Logs, packet capture, topology)
- Azure Monitor
- Traffic Analytics
GCP
- VPC Flow Logs
- Cloud Monitoring
- Network Intelligence Center
Turn on flow logs at the subnet or interface level.
These provide visibility into traffic patterns, security events, infrastructure monitoring services failures, egress costs, etc.
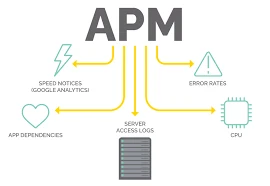
4. Add Synthetic Monitoring
Synthetic monitoring tests network paths proactively—even when no users are active.
You can simulate:
- API calls
- DNS lookups
- Connection tests
- Latency and jitter checks
- SaaS app performance
- Multi-step transactions (login → browse → submit)
Useful tools: Catchpoint, ThousandEyes, Datadog Synthetic, Dynatrace Synthetics.
5. Monitor Real Traffic (RUM + Flow Analysis)
Combine flow logs, packet captures, and real-user monitoring to detect:
- Latency spikes
- Packet drops
- Routing changes
- Misconfigured security groups / NSGs
- Congestion in inter-region paths
- Unexpected egress traffic (cost + security risk)
Flow logs + RUM = visibility into the actual user experience.
6. Deploy Agents or Probes Where Needed
Depending on your environment, deploy:
- Endpoint agents for user experience
- Network probes in VPCs/VNets
- Containers/sidecars inside clusters
- Edge probes at offices, branches, APM services or SD-WAN nodes
Agents help measure:
- App-to-cloud latency
- DNS resolution time
- TLS handshake time
- TCP retransmissions
- Last-mile vs cloud-side delays
7. Build Dashboards
Your dashboards should include:
Network Health
- Latency, jitter, packet loss
- Throughput / bandwidth
- Connection errors
- DNS performance
- API latency
Topology
- Real-time network map
- Cloud resources + links
- Routing paths
- Security group visibility
User/Endpoint Experience
- Per-location performance
- SaaS app availability
- Device health vs network health
Make dashboards role-based (network, cloud, SRE, security).
8. Configure Alerts and Thresholds
Set alerts for:
- Latency above X ms
- Packet loss above X%
- High error rates
- VPC/VNet routing changes
- Excessive east–west traffic
- Cloud cost anomalies (unexpected egress)
- DDoS or brute-force patterns
Use intelligent (dynamic) thresholds when possible to reduce alert fatigue.
9. Analyze and Troubleshoot
Use both cloud and third-party tools to troubleshoot:
Common issues:
- Misconfigured route tables
- Bad firewall/NSG rules
- Overloaded load balancers
- DNS failures
- Inter-region congestion
- Peering or VPN issues
- Packet fragmentation
- MTU mismatches
- Asymmetric routing
Flow logs + packet analysis + synthetic testing quickly reveal root causes.
10. Automate and Integrate
Integrate monitoring with:
- CI/CD pipelines
- ITSM systems (ServiceNow, Jira)
- ChatOps (Slack, Teams)
- AIOps platforms
Automation ideas:
- Auto-remediate route misconfigurations
- Scale up load balancers
- Trigger failover between regions
- Auto-create incident tickets
11. Continuously Optimize
Perform ongoing improvements:
- Tune routing
- Improve DNS latency
- Right-size interconnect bandwidth
- Reduce egress costs
- Optimize TCP/IAM policies
- Periodic network architecture reviews
Cloud networks evolve quickly—so should monitoring.
12. Validate with Regular Testing
Schedule:
- Network health tests
- SLA/SLO validation
- Failover and DR tests
- Performance regression tests
Synthetic and load testing help confirm reliability after changes.


Sign in to leave a comment.