We’ve all been there. It’s Friday afternoon, and a Slack message pops up from the Head of Sales: “The dashboard looks wrong. Why are our North America numbers down 40%?”
Suddenly, the weekend is gone. You spend the next six hours tracing SQL queries, checking API logs, and realizing—far too late—that a software engineer changed a currency field three days ago. The data isn't missing; it’s just wrong. And because no one noticed, the business has been making decisions based on a lie for 72 hours.
This is the reality of "Data Downtime." In the past, we tried to fix this with simple "broken pipe" alerts. But today’s data stacks are too complex for that. We don’t just need to know if the data arrived; we need to know if we can trust it. That is the soul of Data Observability.
What Are Data Observability Tools?
Definition and Core Purpose
At its simplest, Data Observability is the ability to understand what’s happening inside your data stack without having to manually dig through every table. If your data stack is a massive network of underground pipes, observability tools are the sensors that tell you not just where a leak is, but why the pressure changed in the first place.
The goal isn't just to "monitor" data. It’s to ensure that the people who rely on that data—executives, analysts, and customers—never have to ask, "Is this right?"
Data Observability vs. Traditional Data Monitoring
Think of Monitoring as a smoke detector. It’s binary: there is either smoke, or there isn't. It’s great for catching a total system crash, but it won't tell you if the stove was left on or if the air quality is slowly degrading.
Observability is more like a smart-home system. It looks at the whole environment. It tracks trends, notices that the "temperature" of your data distribution is slightly off, and alerts you before the fire starts. Monitoring tells you that something is broken; observability tells you why it’s breaking and what else it’s going to affect.
Why Data Observability Tools Matter for Modern Data Teams
Rising Complexity of Modern Data Pipelines
Ten years ago, data moved from Point A to Point B. Today, it’s more like a subway map. It travels from an app to a warehouse, gets transformed by dbt, pushed to a lakehouse, and pulled into five different BI tools. With every handoff, there is a chance for something to go sideways. We can’t manage this complexity manually anymore.
Preventing Data Downtime and Pipeline Failures
"Data Downtime" is the silent killer of productivity. When a pipeline fails, the work doesn’t just stop—it goes into reverse. You have to backfill data, re-run models, and apologize to stakeholders. Observability tools act as an early-warning system, catching the "silent failures" (like a schema change that didn't technically break the code but ruined the output) before they reach the final report.
Ensuring Reliable Analytics and Reporting
Trust is hard to build and incredibly easy to break. If a VP makes a million-dollar mistake because of a buggy dashboard, they won’t trust that dashboard again for six months. Observability is the "insurance policy" for your data team’s reputation.
Key Capabilities of Data Observability Tools
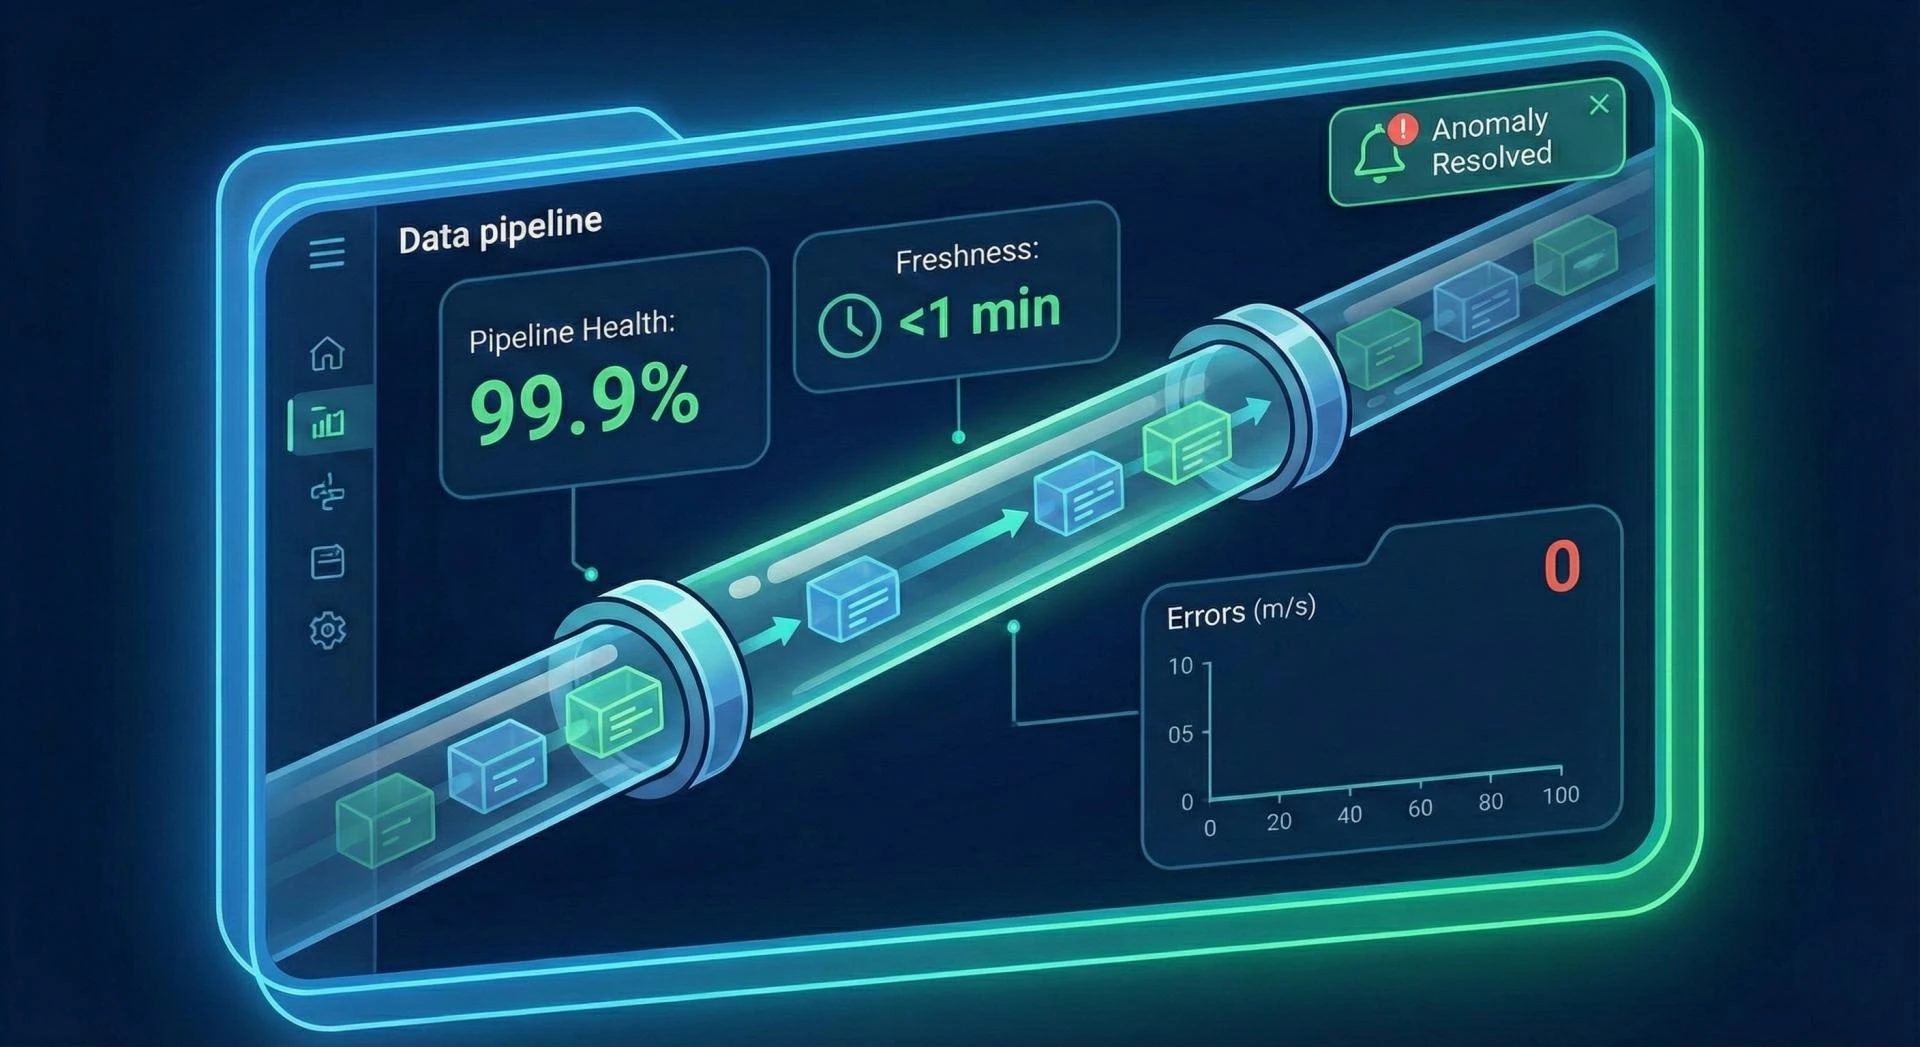
What do these tools actually do? Most focus on five specific areas: Freshness, Distribution, Volume, Schema, and Lineage.
End-to-End Pipeline Visibility
You shouldn't have to log into five different tools to see if your data is healthy. A good observability tool gives you a "bird’s eye view" of the entire journey, from ingestion to the final visualization.
Data Quality Monitoring and Anomaly Detection
Instead of you telling the tool what "bad data" looks like, the tool learns what "good data" looks like. It uses machine learning to notice that your Tuesday morning ingestion is usually 50GB, so when only 5GB shows up, it knows something is wrong without you writing a single line of code.
Schema Change and Volume Tracking
The most common cause of data issues is human error—specifically, someone changing a table structure upstream. Observability tools track these changes in real-time. If a column is deleted or a data type changes from a "float" to a "string," you’ll know within minutes, not days.
Lineage and Impact Analysis
This is the "Where did this come from?" and "Who does this break?" map. If you find an error in a specific table, Lineage allows you to trace it back to the source. Even better, Impact Analysis tells you exactly which Looker dashboards will be wrong if you don't fix it.
How Data Observability Tools Improve Data Quality
Proactive Issue Detection and Alerts
Most data teams find out about problems from their users. That’s a "reactive" culture. Observability flips the script. It allows the data team to find the error, fix it, and send a message saying: "Hey, we noticed a glitch in the sales data this morning, it's already patched," before a user ever sees a wrong number.
Faster Root Cause Analysis
The "detective work" of data engineering is the most draining part of the job. Observability tools automate the boring parts of troubleshooting. By correlating metadata, they can point you to the exact failed job or the specific null-value spike that caused the headache.
Reducing Data Errors at Scale
You can manually check ten tables. You can’t manually check ten thousand. As companies grow, "scale" usually means "more errors." Observability tools provide a consistent layer of automated oversight that doesn't get tired or miss a row.
Business Benefits of Using Data Observability Tools
Increased Trust in Data and Dashboards
When data is reliable, the "culture" of the company changes. Meetings stop being about "whose numbers are right" and start being about "what the numbers are telling us to do."
Faster Decision-Making
Reliability equals speed. When you don't have to double-check every report, you move faster. You can launch products, adjust pricing, and pivot strategies with the confidence that you're standing on solid ground.
Improved Operational Efficiency
Data engineers are expensive and hard to find. Do you want them spending 40% of their week "fixing pipes," or do you want them building the features that will grow the business? Observability returns that time to the team.
Use Cases for Data Observability Tools
- Data Engineering: Automating the "health checks" of ETL pipelines so engineers can sleep through the night.
- Analytics and BI: Ensuring that "Golden Data" stays golden. It’s the safety net for the people who present data to the board.
- AI and Machine Learning: Models are only as good as the data they eat. If the data "drifts" (changes in meaning or distribution), the model will fail. Observability is the "food inspector" for AI.
Choosing the Right Data Observability Tools
It’s easy to get overwhelmed by the market. When you're looking at tools like Monte Carlo or Acceldata, keep three things in mind:
- Does it fit your stack? If it doesn't have a native, deep integration with Snowflake, Databricks, or whatever you use, it’s just another silo.
- Is it easy to use? If your team has to spend three months configuring "rules" for every table, it’s not an observability tool—it’s a part-time job.
- Is it secure? Your data is your most sensitive asset. Ensure the tool uses metadata-first approaches so your actual customer data stays behind your firewall.
Data Observability vs. Data Quality Tools
It’s not an "either/or" situation.
- Data Quality Tools (like Great Expectations) are for when you have specific rules you need to enforce (e.g., "Zip codes must be five digits").
- Data Observability Tools are for the "unknown unknowns"—the weird, unexpected failures that happen in complex systems.
The rule of thumb: Use Quality tools for business logic; use Observability tools for system reliability.
The Future: Self-Healing Pipelines
We are moving toward a world where data pipelines aren't just "monitored," but "self-correcting." Imagine a system that sees a schema change, realizes it’s a non-breaking update, adjusts the downstream models automatically, and simply sends you a summary of what it did.
We aren't there yet, but with the help of AI-driven observability, we are getting closer to a world where "Data Downtime" is a thing of the past.
Conclusion
Data is no longer a "side project" for IT; it is the heartbeat of the modern company. But a heartbeat only matters if it’s steady. Data Observability is how we ensure that the pulse of our organization stays strong, reliable, and visible. It’s time to stop guessing and start observing.


Sign in to leave a comment.