We’re living in the age of big data. The volumes of information that are produced by businesses, customers, and employees alike can be utilised to produce comprehensive insights into how processes can be streamlined, fine-tuned, or even eradicated through the fresh perspectives they bring. But as the wealth of information available to us grows, many small businesses are coming across difficulties in how to present their big data - particularly to remote teams.
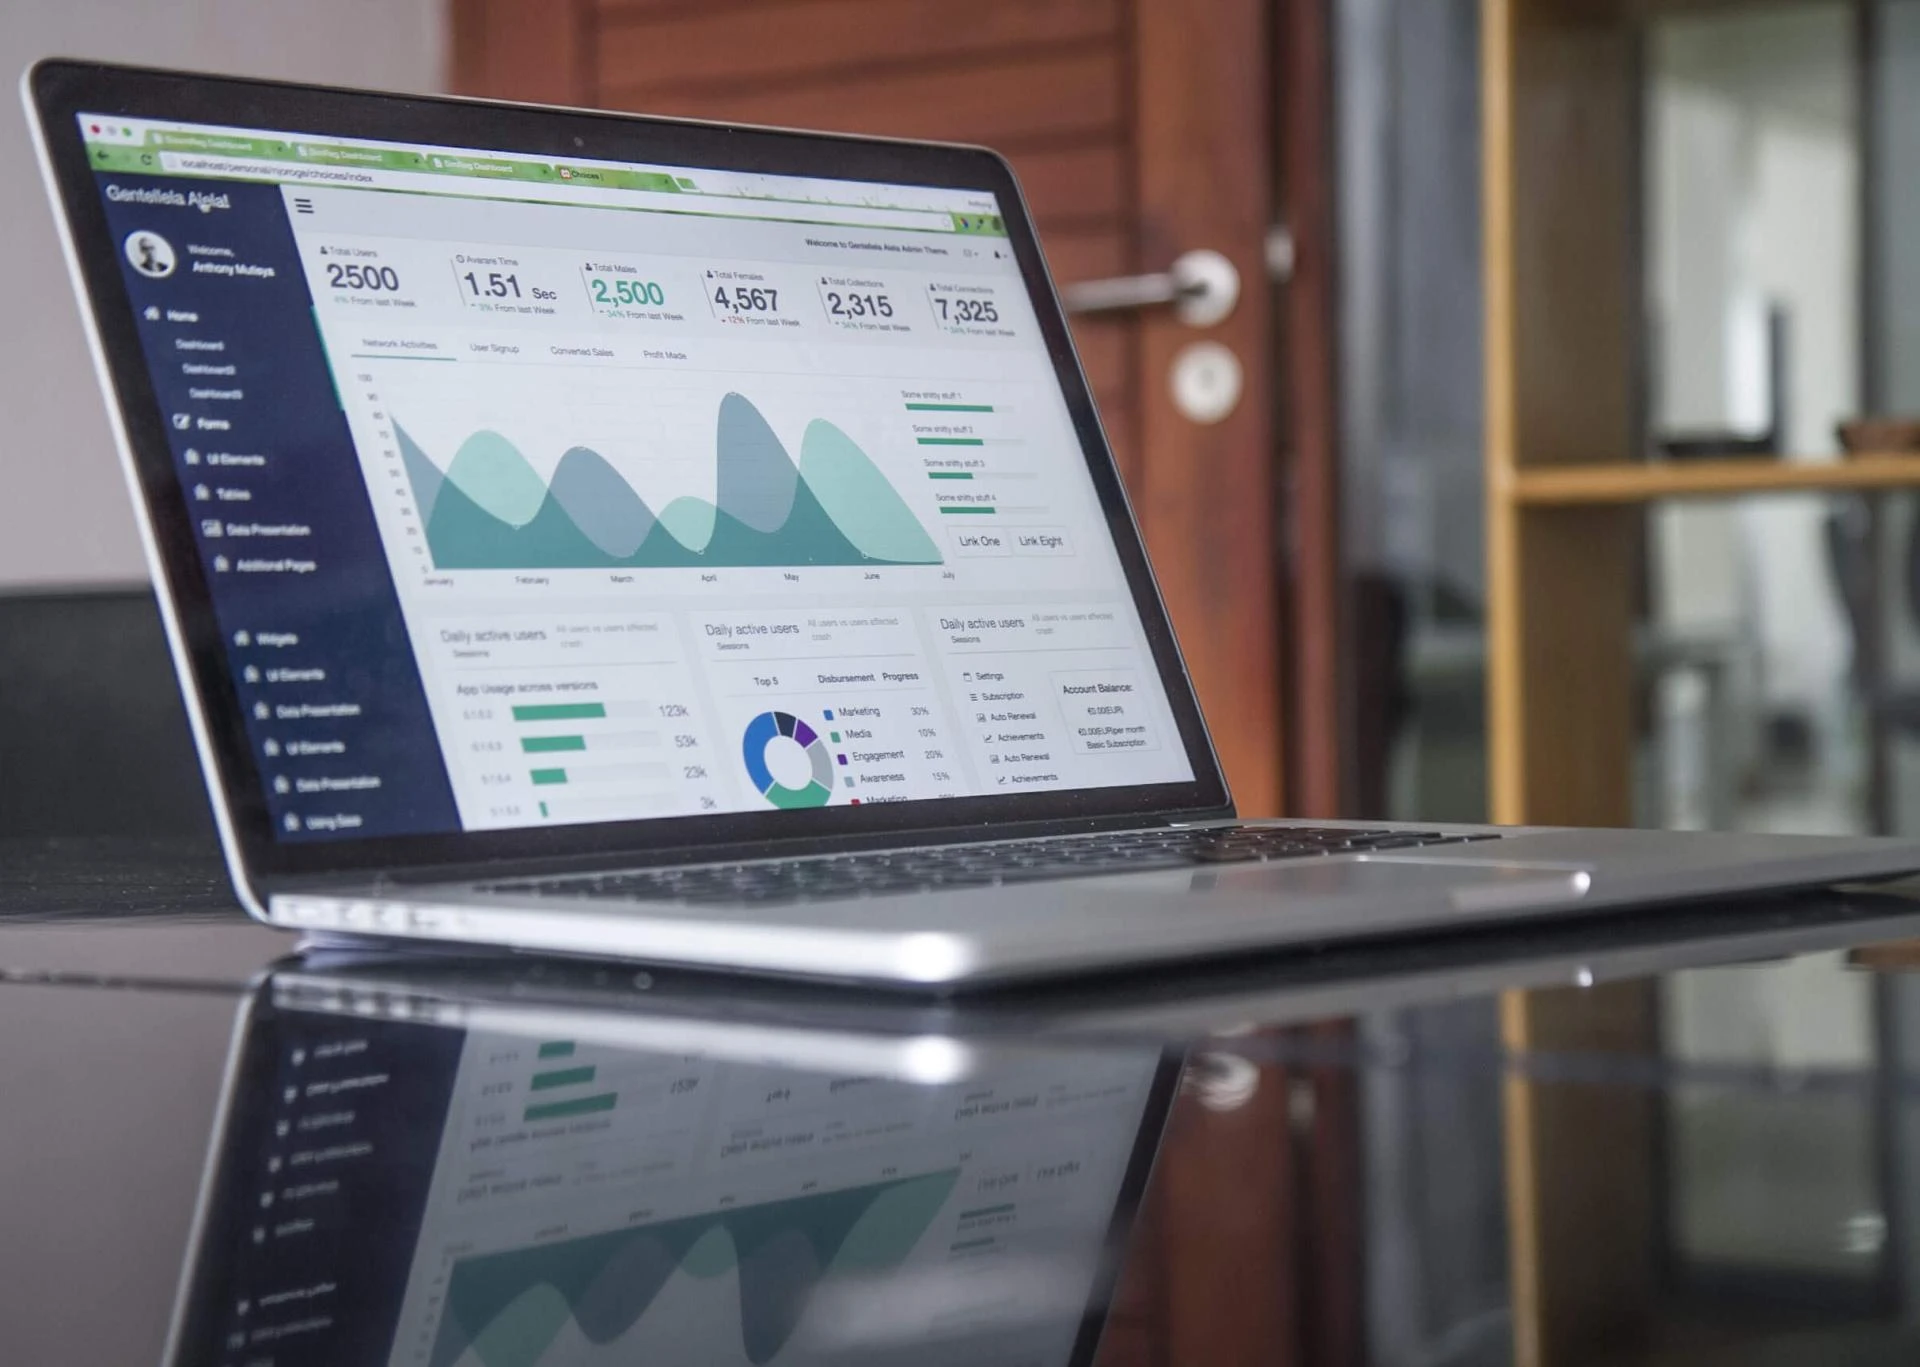
The problem with big data is that it’s, well, big. Insights can be sprawling, and for many teams, getting to the meat of the matter can be a challenge in itself.
(Image: Yahoo Finance)
Another challenge is that the big data market is showing no signs of slowing down, meaning that the analytical insights available to businesses are likely to become more complex and far more impactful as a result.
For many businesses, big data is an unavoidable opportunity to intelligently grow, and to become less wasteful with resources. The underlying fear for many managers is that the failure to embrace data will leverage an opportunity for competitors to overtake them.
One of the biggest challenges facing small businesses isn’t gaining access to the large volumes of data produced around the company on a daily basis, rather the difficulty that can be had in presenting such hefty metrics.
Fortunately, there are many intelligent solutions available online that can help with converting big data into easy-to-follow analytical insights and engaging charts and graphs. For small businesses there may be no better option than the free and cost-effective premium solutions offered by Powered Template.
Presenting Big Data with Powered Template Solutions
Powered Template is a comprehensive online resource library that showcases more than 94,000 templates that carry a range of purposes - from PowerPoint presentation designs, to business cards, to web templates, and, significantly, to data presentation tools.
Crucially, Powered Template offers a wide range of free-to-use options for businesses to embrace and use as they wish - provided that the material features a visible attribution to the website in return.
The beauty of Powered Template is that the platform has a huge selection of pre-designed graphs, charts, infographics, and tables that are professionally designed and 100% editable. These templates can present themselves as a fantastic low-cost, 100% editable, and reusable option to showcase key swathes of big data to employees in an effective way.
Exploring Powered Template’s array of different graphs returns thousands of results that cater to a range of different business needs.
Notably, every professionally designed template comes equipped with a star rating system that helps to indicate whether other users who have downloaded and used the design have enjoyed the asset. To the bottom right corner of some designs, a red thumbnail depicting a crown can be seen - this indicates that the item is a premium download, and requires a subscription for use.
Let’s take a closer look at one of the options that our search has conjured up. The Analytics Concepts Charts designed and published by Powered Template stands out because it’s attained an average 5-star rating across 215 user reviews. Furthermore, the package features 16 slides that can all be repurposed to present varying forms of data to audiences.
Significantly, we can see further information surrounding the template, and the compatibility of the slides works with Microsoft PowerPoint, Google Slides, Apple Keynote, and Apache OpenOffice. Furthermore, the download itself comes in the form of a ZIP file and will be featured in a 4:3 aspect ratio.
Helpfully, Powered Template also features a button that produces some of the most similar templates to the one selected that have been uploaded to the site over recent years - just in case your chosen selection isn’t quite the right fit to suit your needs.
When it comes to presenting big data, flexibility is essential when adopting templates that are capable of communicating information.
Whether your employees are in-house or operating remotely, it’s vital that they can see the data that you’re presenting to them and are aware of the implications of such insights. This means that downloading a collection of pre-designed templates could be an excellent way of giving your business some flexibility whilst adopting a consistent theme that can be modified, used, and re-used throughout the company.
Downloading Your Designs
When you’ve decided to download your template, you may be presented with two options. One option will offer you the choice of downloading for free - provided that an attribution is added somewhere within the content, and the other option will be for a premium download.
Some designs are exclusive to premium subscribers, so the option of a free download won’t apply. However, for businesses looking for a functional way of showcasing big data analytics to employees in a more engaging manner, it can be highly beneficial to take on a premium membership with Powered Template.
In the earlier image, we can see that our resource was available to download along with Powered Template’s extensive library of other templates from $8.25 per month. This option comes as part of the platform’s Annual Basic plan, and works out at a yearly rate of $99, which enables users to make 200 downloads per month and up to 50 downloads per day.
Alternatively, a singly month subscription allows up to 100 downloads over the course of the time period and up to 10 downloads per day. Powered Template also offers an intuitive On Demand option, whereby users can purchase 10, 20, 50, or 150 downloads which can be redeemed at any point within 12 months.
The beauty of big data is that it can provide actionable insights that can revolutionise all aspects of a business. With Powered Template’s suite of expertly designed templates, it can be much easier for businesses to present their raw data to both in-house and remote employees in an engaging and informative manner.


Sign in to leave a comment.