Manufacturers today operate in a high-pressure environment where every minute of downtime and every percentage drop in OEE directly impacts profitability. While most factories already collect vast amounts of data from ERP, MES, shop-floor systems, and IoT sensors, decision-makers often struggle to turn that data into clear, real-time insights. This is where partnering with a specialized power bi development company and the right Manufacturing software development services can transform day-to-day operations.
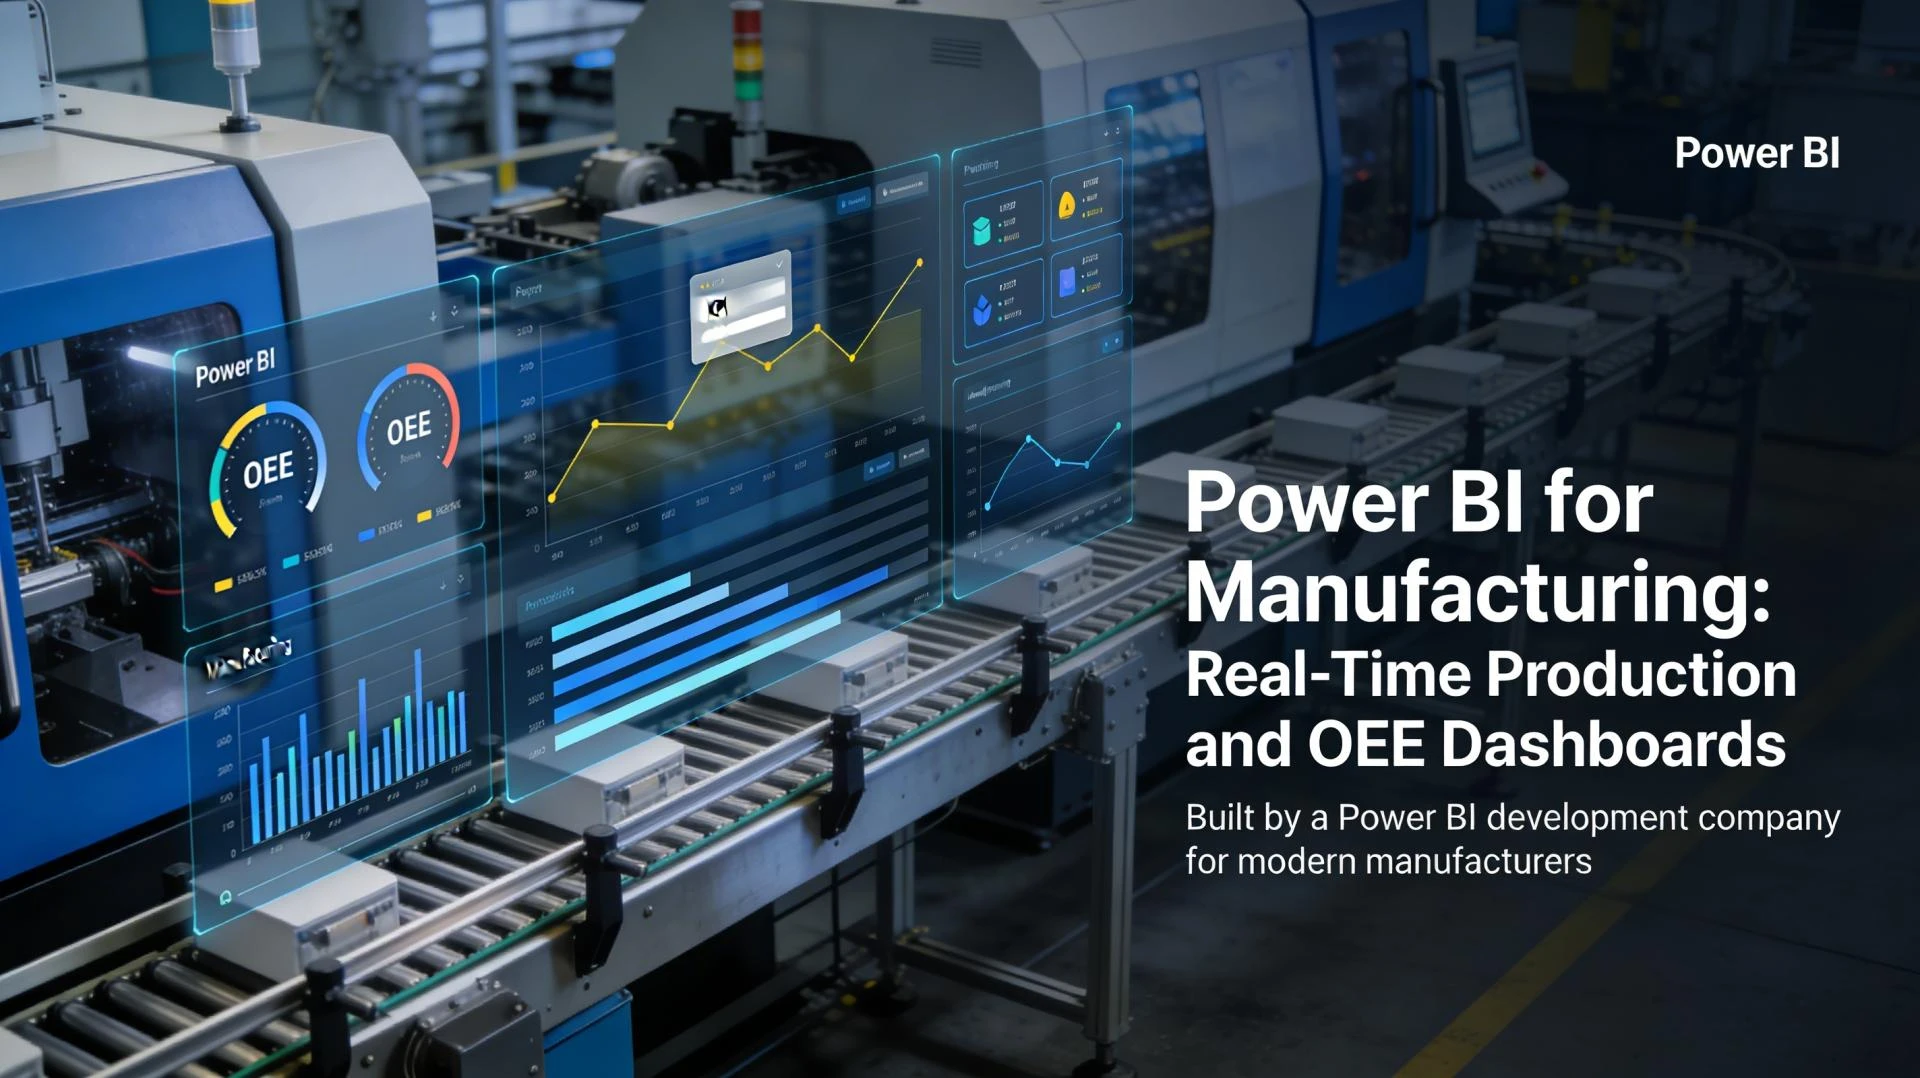
By building real-time production and OEE dashboards in Power BI, manufacturers gain a single, trusted view of performance across plants, lines, and shifts. These dashboards centralize key metrics like OEE, downtime, scrap, first pass yield, and cost per unit, so leaders can move from reactive firefighting to proactive, data-driven decision-making.
Why Real-Time Dashboards Matter in Manufacturing
On a typical shop floor, issues like unplanned downtime, bottlenecks, and quality problems are often detected late—sometimes hours or days after they occur. That delay makes root-cause analysis harder and leads to repeated losses. Real-time dashboards built by an experienced power bi development company close this gap by streaming data from MES, ERP, and IoT systems directly into visual, easy-to-read views.
Key benefits include:
- Faster detection of performance drops, enabling rapid troubleshooting and corrective actions.
- A shared, objective view of KPIs across operations, maintenance, quality, and leadership teams.
- Immediate visibility into whether improvement initiatives are actually delivering results.
When combined with tailored Manufacturing software development services, Power BI dashboards become part of a tightly integrated ecosystem that spans production planning, inventory management, quality, and finance.
Understanding OEE and Core Production KPIs
Overall Equipment Effectiveness (OEE) is one of the most important metrics for any manufacturer, because it combines availability, performance, and quality into a single score. Power BI makes it easy to calculate and visualize OEE and related indicators across multiple machines, lines, and plants in near real time.
A robust production and OEE dashboard typically includes:
- OEE: Overall view of how effectively equipment is being used, tracking availability, performance, and quality.
- Throughput and production output: Units produced per hour, shift, or day, compared against plan and historical trends.
- Planned vs unplanned downtime: Time lost to breakdowns, setups, and changeovers, with drilldowns into root causes.
- Defect rate and scrap: Percentage of nonconforming units and scrap costs, often broken down by product, shift, or material.
- First Pass Yield (FPY): Share of units that meet quality standards without rework, a key indicator of process stability.
An expert power bi development company will design these KPIs in a way that matches your actual data structure and production processes, ensuring accurate, trusted numbers. When combined with Manufacturing software development services, these KPIs can be fed from custom shop-floor applications, machine data collectors, and ERP extensions.
What a High-Impact Production & OEE Dashboard Looks Like
Well-designed Power BI dashboards for manufacturing share some common design patterns. The best dashboards are role-based, focusing on the decisions that specific users need to make, such as plant managers, maintenance teams, or quality leaders.
A typical real-time production and OEE dashboard will feature:
- A one-page overview displaying OEE, output, downtime, and quality at a glance, with clear targets and alerts.
- Filters for plant, line, shift, product, and date range, allowing users to slice performance without complex queries.
- Visuals like KPI cards, line charts, bar charts, and Pareto charts to highlight trends and top contributors to loss.
- Drillthrough pages for specific machines or lines to investigate downtime causes, defect patterns, or energy usage.
By working with a power bi development company experienced in industrial analytics, manufacturers can ensure that dashboards are not just visually appealing but also aligned with Lean, TPM, and continuous improvement practices.
Data Sources: Bringing ERP, MES, and IoT Together
One of the biggest challenges in manufacturing analytics is connecting and harmonizing data from multiple systems. Power BI supports integration with ERP platforms, MES tools, maintenance systems, SCADA, and IoT hubs, which makes it a strong foundation for real-time dashboards.
Common data sources for production and OEE dashboards include:
- ERP: Production orders, material usage, labor costs, and inventory levels.
- MES and shop-floor systems: Machine status, cycle times, shift reports, and production counts.
- IoT sensors: Real-time signals for temperature, vibration, energy consumption, and equipment health.
- Quality and LIMS systems: Test results, nonconformances, and inspection data.
Manufacturing software development services often play a critical role here by building APIs, data pipelines, and microservices that normalize and expose this data in a consistent way. A power bi development company can then design the data model, DAX calculations, and visuals on top of that foundation.
Step-by-Step: How a Power BI Development Company Builds These Dashboards
Implementing real-time production and OEE dashboards usually follows a structured roadmap. While every factory is unique, a typical approach includes the following steps.
- Requirements and KPI definition
- Identify who will use the dashboard (plant managers, operations heads, maintenance, quality).
- Define the 5–10 core KPIs that matter most, such as OEE, downtime, throughput, FPY, and scrap rate.
- Data assessment and integration
- Map where each KPI’s data currently lives across ERP, MES, IoT, and spreadsheets.
- Use Manufacturing software development services to create connectors, data ingestion jobs, and a staging layer or data warehouse if needed.
- Data modeling and DAX
- A power bi development company designs a semantic model that relates orders, machines, shifts, and events.
- DAX measures are built to calculate OEE components, downtime categories, and quality metrics accurately.
- Dashboard design and UX
- Layouts follow best practices: an executive summary at the top, trends in the middle, and detail tables at the bottom.
- Colors are used consistently to show good vs poor performance, and thresholds or alert rules are clearly marked.
- Security, deployment, and training
- Role-based security ensures each user sees only the plants and lines they are responsible for.
- Dashboards are published to the Power BI service with scheduled or real-time refresh, and users are trained to interpret and act on insights.
This structured approach ensures that dashboards deliver immediate value while laying a scalable foundation for later use cases like inventory, maintenance, and financial analytics.
Use Cases: How Manufacturers Use Real-Time OEE Dashboards
Real-time production and OEE dashboards can drive improvements across many aspects of manufacturing operations. A few common scenarios include:
- Reducing unplanned downtime: Maintenance teams monitor breakdown trends and MTBF/MTTR, prioritize root causes, and plan preventive maintenance more effectively.
- Improving quality and FPY: Quality leaders track defect rates and FPY by line, material, or supplier, quickly spotting patterns that require process changes.
- Balancing line performance: Operations teams compare throughput and OEE across shifts and plants to identify best-performing lines and replicate their practices.
- Controlling cost per unit: Finance and operations track the impact of scrap, rework, and downtime on unit costs, enabling more accurate pricing and cost reduction programs.
Working with a power bi development company that understands these use cases helps ensure that each dashboard is anchored to real business decisions, not just data visualization.
The Role of Manufacturing Software Development Services
While Power BI is a powerful analytics layer, it delivers maximum impact when integrated with tailored operational systems. Manufacturing software development services complement analytics by building the digital backbone that feeds high-quality data into Power BI.
These services may include:
- Custom production tracking and machine interfacing applications.
- Middleware and APIs connecting legacy machines to modern data platforms.
- Shop-floor mobile apps for operators to log downtime reasons, defects, or shift notes.
- Extensions to ERP or MES that capture additional data needed for analytics.
By combining this custom development with dashboards from a power bi development company, manufacturers create an end-to-end digital ecosystem—from data capture on the shop floor to real-time insights in the boardroom.
Getting Started: From Pilot Dashboard to Enterprise Analytics
For many manufacturers, the best way to begin is with a focused pilot: one plant, one line, and a small set of critical KPIs. A typical starting point includes a production and OEE dashboard, a quality dashboard, and a simple executive view.
A capable power bi development company can usually deliver such a pilot in a matter of weeks, especially when paired with your internal IT team or existing Manufacturing software development services partner. Once stakeholders see the value—faster decisions, fewer surprises, and measurable improvement in OEE—it becomes easier to justify scaling the solution to more lines, plants, and use cases.
If you share a bit about your target manufacturing segment (discrete, process, automotive, electronics, etc.), I can tailor this article further with more specific examples and KPIs for that niche.


Sign in to leave a comment.