Navigating the NSE Option Chain can be a game-changer for traders who want to make informed decisions in the options market. Two of the most critical indicators in the NSE Option Chain are Open Interest (OI) and Volume. These metrics are more than just numbers—they reveal trader sentiment, market trends, and potential price movement.
In this comprehensive blog, we’ll explore the meaning of Open Interest and Volume, their differences, and how to use them effectively in the NSE Option Chain to build a robust trading strategy.
What Is the NSE Option Chain?
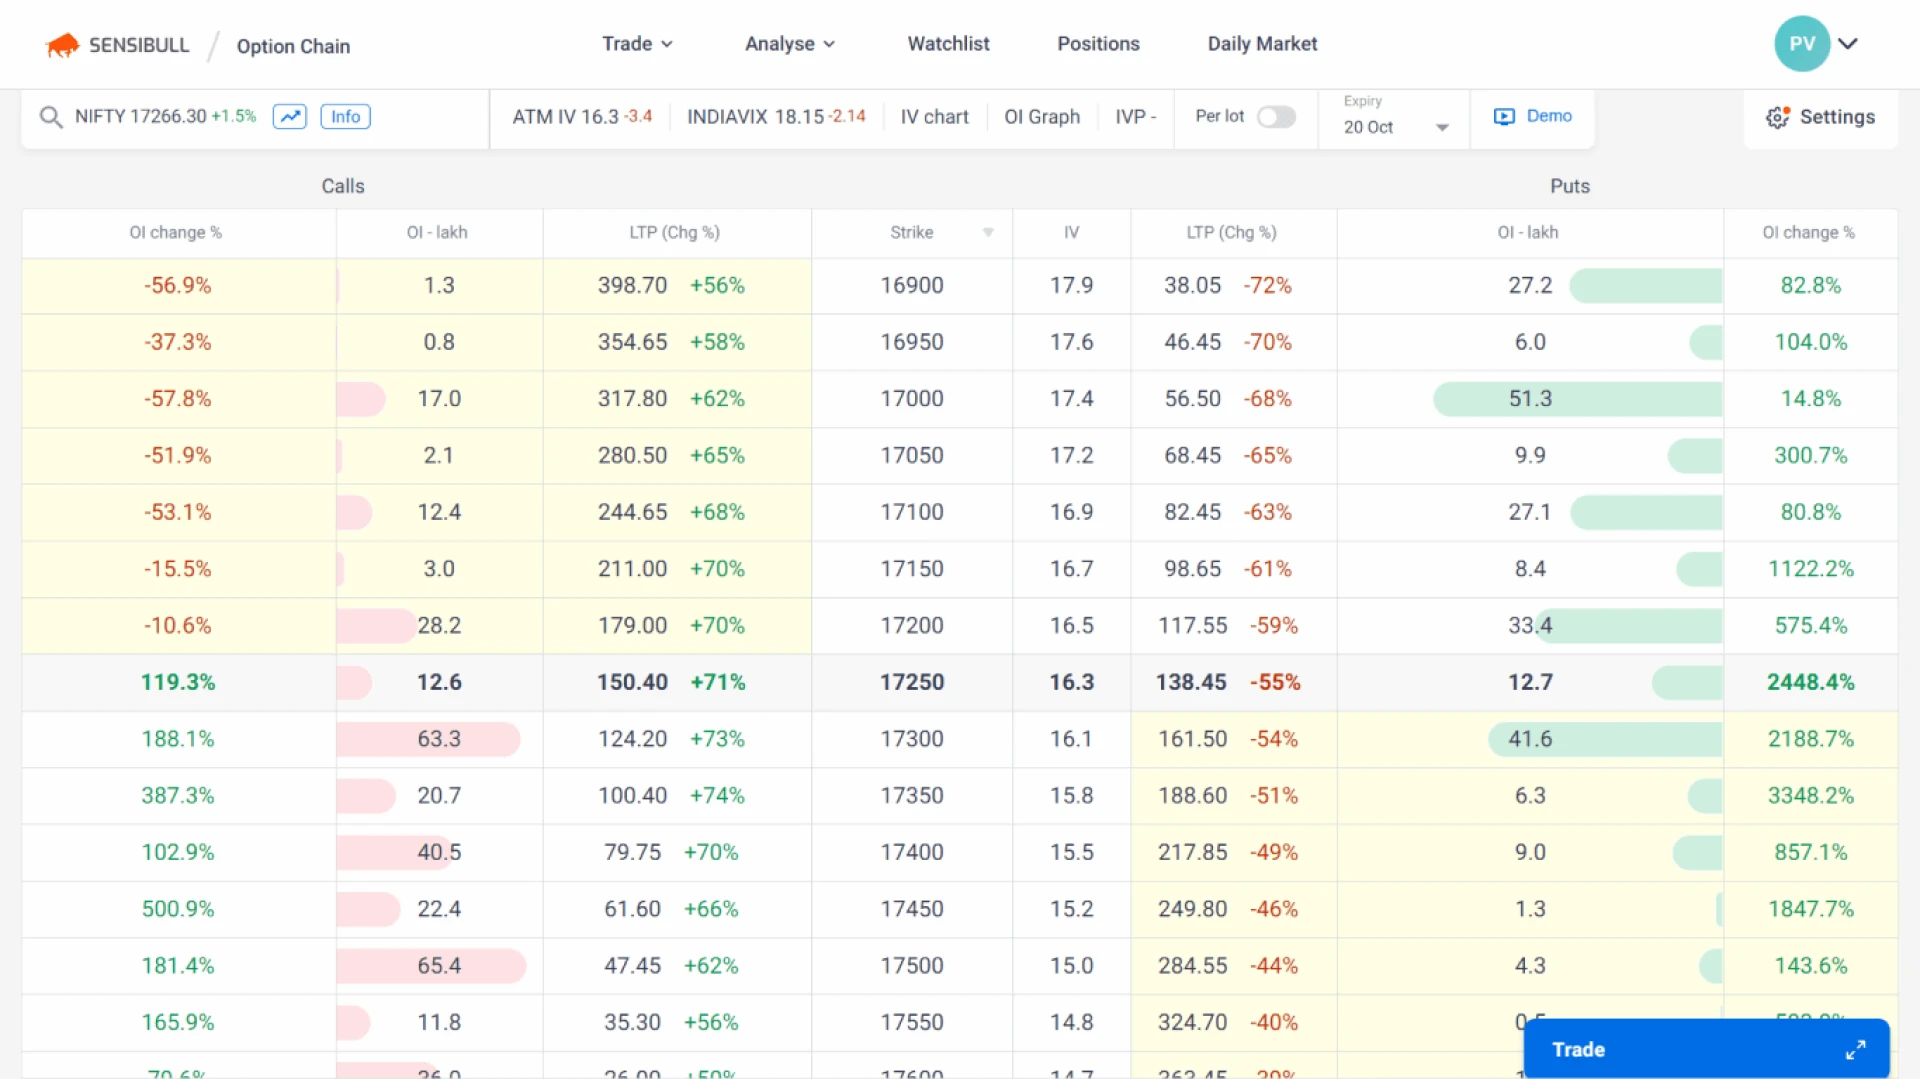
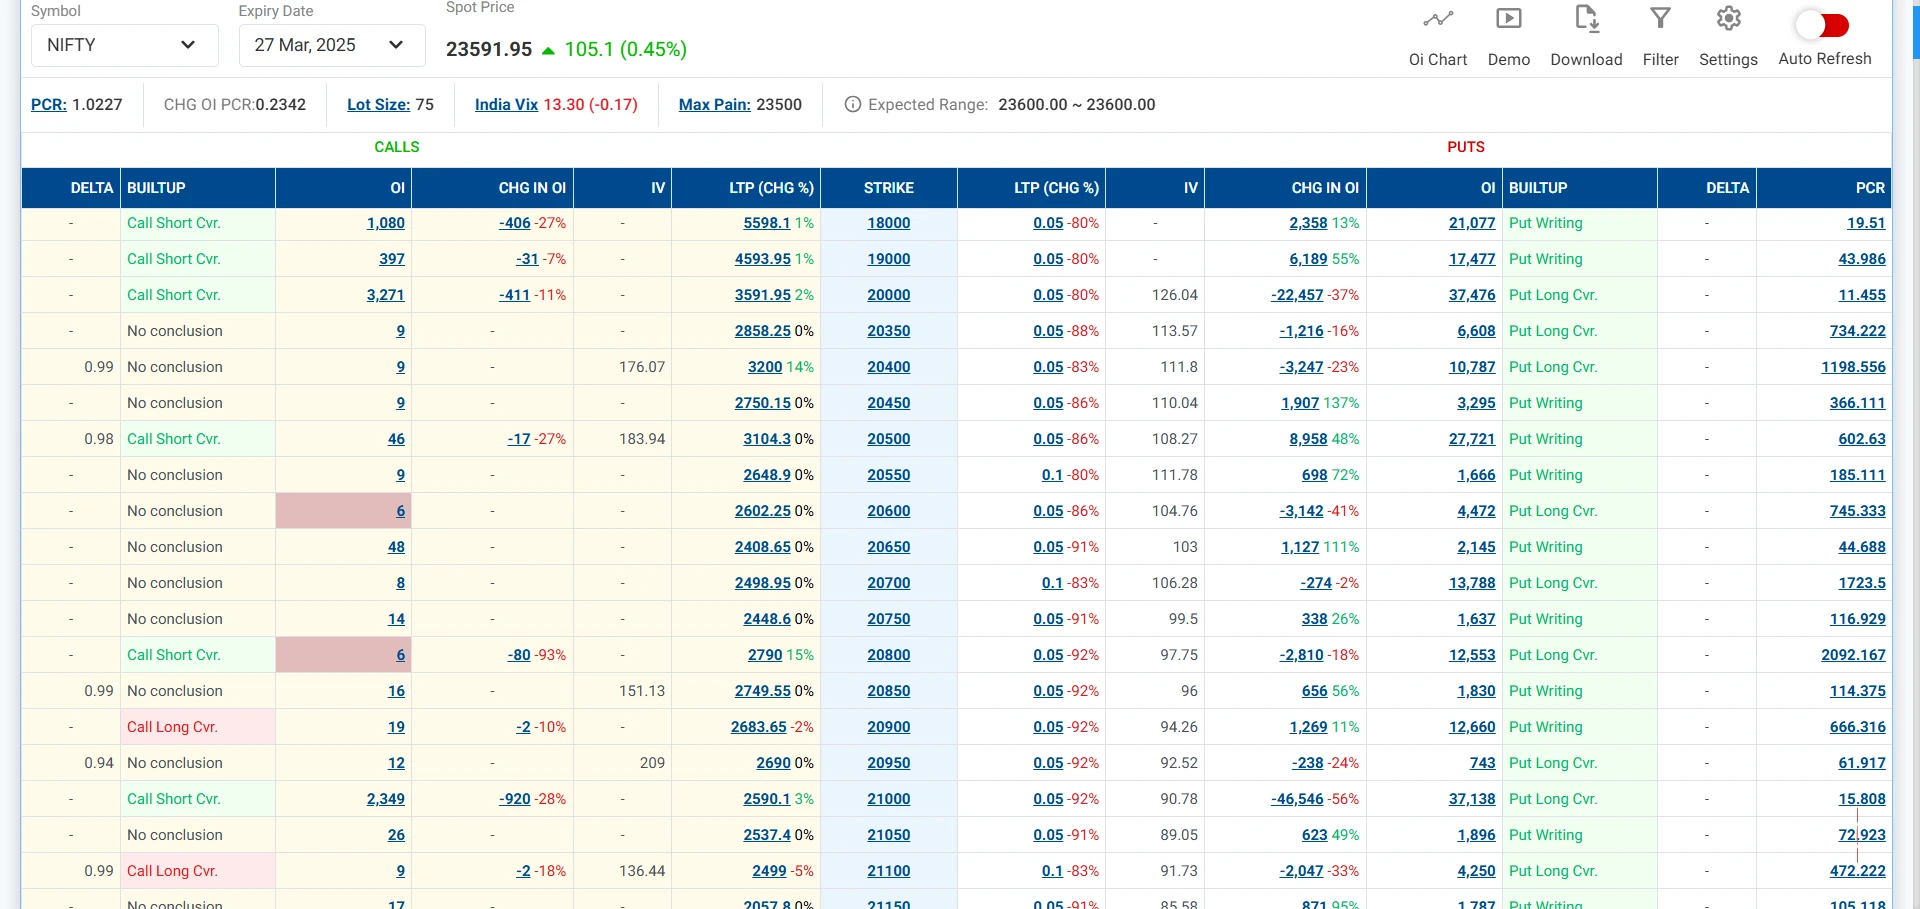
The NSE Option Chain is a tabular display of all available options contracts for a particular security listed on the National Stock Exchange of India (NSE). It includes vital information such as strike prices, premiums, expiry dates, Open Interest, Volume, implied volatility, and bid-ask prices.
Traders use the NSE Option Chain to analyze market sentiment, identify support and resistance levels, and evaluate trading opportunities in options.
Understanding Open Interest in the NSE Option Chain
What is Open Interest?
Open Interest (OI) in the NSE Option Chain refers to the total number of outstanding option contracts that have not been settled or closed. It represents the liquidity of a particular strike price and expiry combination.
For example, if one trader buys an option and another sells it, the open interest increases by one. If either of them closes their position, the open interest decreases.
Why Open Interest Matters
Open Interest is a valuable indicator in the NSE Option Chain because it shows the strength or weakness behind a price move. High OI indicates strong trader participation and interest in a specific level, whereas low OI suggests a lack of conviction.
Key Points:
- Rising OI with Rising Price: Indicates bullish sentiment.
- Rising OI with Falling Price: Indicates bearish sentiment.
- Falling OI with Rising Price: Indicates short-covering.
- Falling OI with Falling Price: Indicates long unwinding.
Understanding Volume in the NSE Option Chain
What is Volume?
Volume in the NSE Option Chain represents the number of contracts traded in a particular session. It resets daily and reflects trading activity rather than the number of open positions.
For instance, if 10 contracts are traded today at a certain strike price, the volume will be 10 for that strike, regardless of whether these contracts were opened or closed.
Why Volume Is Important
Volume indicates market activity and liquidity. A strike price with high volume is likely to be a significant level in the market, either as support or resistance.
Key Differences Between Volume and Open Interest:
FeatureOpen InterestVolumeDefinitionOutstanding contractsContracts traded during the dayResets DailyNoYesIndicatesMarket sentiment and liquidityIntraday trading activityUseful forUnderstanding positions heldSpotting trading trends
How to Use Open Interest and Volume in the NSE Option Chain
1. Spotting Market Trends
One of the most powerful uses of the NSE Option Chain is trend identification. Combining Open Interest and Volume can give a clear indication of whether a move is genuine.
- If both OI and Volume are increasing on the call side, it signals bullish sentiment.
- If both are rising on the put side, it implies bearish sentiment.
2. Identifying Support and Resistance Levels
By analyzing which strike prices have the highest Open Interest in the NSE Option Chain, you can pinpoint crucial support and resistance zones.
- High OI in Puts: Indicates strong support levels.
- High OI in Calls: Indicates resistance levels.
Traders often use this data to decide entry and exit points, especially around expiry dates when price tends to gravitate toward max pain levels.
3. Understanding Market Sentiment
Sentiment analysis through the NSE Option Chain can be incredibly accurate. For example:
- A sharp rise in Call OI near current market price = bearish sentiment.
- A sharp rise in Put OI below market price = bullish sentiment.
Volume confirms whether the Open Interest buildup is active or passive. High volume + high OI = active participation.
Real-Life Example of NSE Option Chain Analysis
Imagine Nifty is trading at 22,000. In the NSE Option Chain, you observe:
- 22,000 Call OI = 3 million contracts
- 22,000 Put OI = 5 million contracts
- Call Volume = 500,000
- Put Volume = 800,000
This suggests that the 22,000 strike has strong support because of higher Put OI and Volume. Traders are betting that Nifty won’t fall below 22,000, indicating bullish sentiment.
Mistakes to Avoid When Reading the NSE Option Chain
- Relying on OI Alone: Without Volume, OI can be misleading. Always combine both metrics for clarity.
- Ignoring Expiry Dates: Different expiry contracts can show varying sentiment. Be sure to match the expiry with your trading horizon.
- Falling for Traps: High OI doesn’t always mean strong support or resistance. It could also indicate hedging by institutions.
- Skipping Context: Always view the NSE Option Chain data in the context of broader market news, earnings, and global cues.
Tools to Analyze the NSE Option Chain
Several tools and platforms provide detailed NSE Option Chain analysis:
- NSE India Official Website: Provides real-time data directly from the exchange.
- TradingView: Offers visual representation of OI buildup.
- Fyers / Zerodha / Upstox: Indian brokers with integrated option chain analysis.
- Sensibull: Specializes in options strategy building using NSE Option Chain data.
Final Thoughts: Mastering the NSE Option Chain
Understanding Open Interest and Volume in the NSE Option Chain is vital for anyone involved in options trading. These two metrics act as windows into market psychology and help traders make smarter decisions.
By carefully analyzing OI and Volume together, traders can:
- Anticipate breakout and breakdown levels
- Confirm trends or spot reversals
- Build options strategies with greater precision


Sign in to leave a comment.