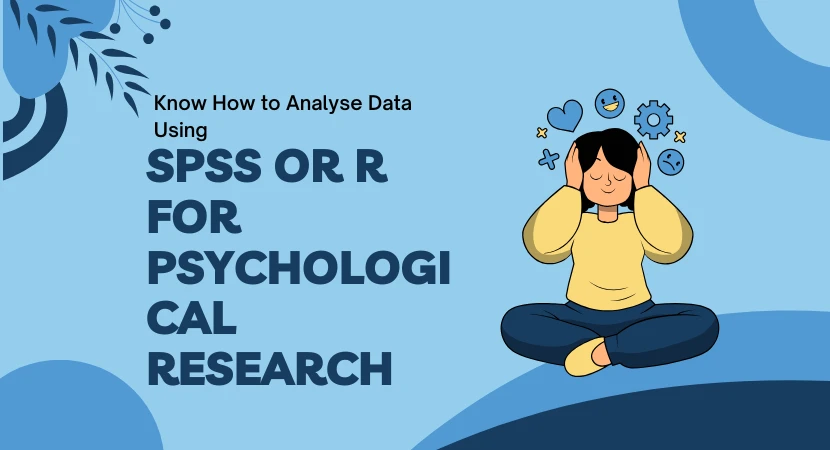
Do you know, in psychological research, data analysis helps you make sense of the info that you collect from experiments, surveys and observations. The most common tools used in this situation are SPSS and R. SPSS is a software that helps beginners run statistical tests. R is a coding-based tool that offers flexibility. Moreover, if you want to address this issue in your project and need assistance, you can seek help from university assignment help experts for clarity. Plus, this post will discuss the steps on how you can analyse data using SPSS and R.
Steps for Analysing Psychological Data Effectively
If you want to analyse psychological data effectively, you first need to import psychological data, clean research data, and overview descriptive statistics, etc. To learn about all these steps in detail, dive into this section.
SPSS vs R
They are both tools that are used to analyse data in physiological research. But they both work in very different ways. SPSS is a software with a simple and user-friendly interface. Additionally, it is very easy to learn and is often used by beginners in starting, those who don't write code.
On the other hand, R is a programming language. Instead of just clicking, you need to run the command, write and analyse it. Most importantly, it's free, flexible and is used for advanced and Customised analysis.
Importing Psychological Data
It means bringing your data into software such as SPSS or R to analyse it. When it comes to SPSS, importing data is easy to learn. You can go to file>open>data. After that, select your file, and SPSS will start loading it.
On the other hand, R is different. In this case, you need to write simple code to import the data. For example, you can use a function such as read.csv to load your data.
Cleaning Research Data
It means ensuring the data that you are examining is accurate and ready to use. As you know, raw data contains errors such as missing values or typos. In SPSS, it's done with the help of built-in functions such as finding missing values or sorting data to identify outliers.
On the other hand, in R, you can use packages such as dplyr to filter, replace or remove unnecessary data. It is vital because you know that a small error can make an enormous impact on overall results.
Descriptive Statistics Overview
It assists you learn your at a single glance. All these are simple summaries such as means, mode and median. It is the reason why researchers don't jump on complex errors directly; they use these statistical methods to get an idea. In SPSS, these scores are easily found using approaches, such as descriptives or frequencies.
On the other hand, in R, you can use functions such as summary(), mean(), and sd(). All these are vital for spotting patterns. To learn about all these in detail, seek support from Instant Assignment Help experts.
Running T-Tests
A T-test is used to compare the means of two different groups. There are several types of tests. Independent and paired. They are both used differently in SPSS and R. In SPSS, you can perform this test by going to Analyse, then compare means and lastly independent samples.
On the other hand, in R, function like t.test() is most widely used. This result will give you a p-value. If it's less than 0.5, then it is considered statistically significant. Overall, t-tests are simple yet powerful in psychological research.
Performing ANOVA Tests
Firstly, do you know what ANOVA stands for? It is an analysis of variance. Additionally, it is used when you want to compare three or more groups or means. It helps you tell whether one group is significantly different, but not the exact difference. In SPSS, you can go to Analyse, then compare means and lastly, one-way ANOVA.
On the other hand, in R, it's different. In this, it uses the aov() function. The output will come in the form of an F-statistic or a p-value. Similarly, if the value is less than 0.5, then there is a difference. Therefore, the primary work of ANOVA is to help psychologists analyse complex programs.
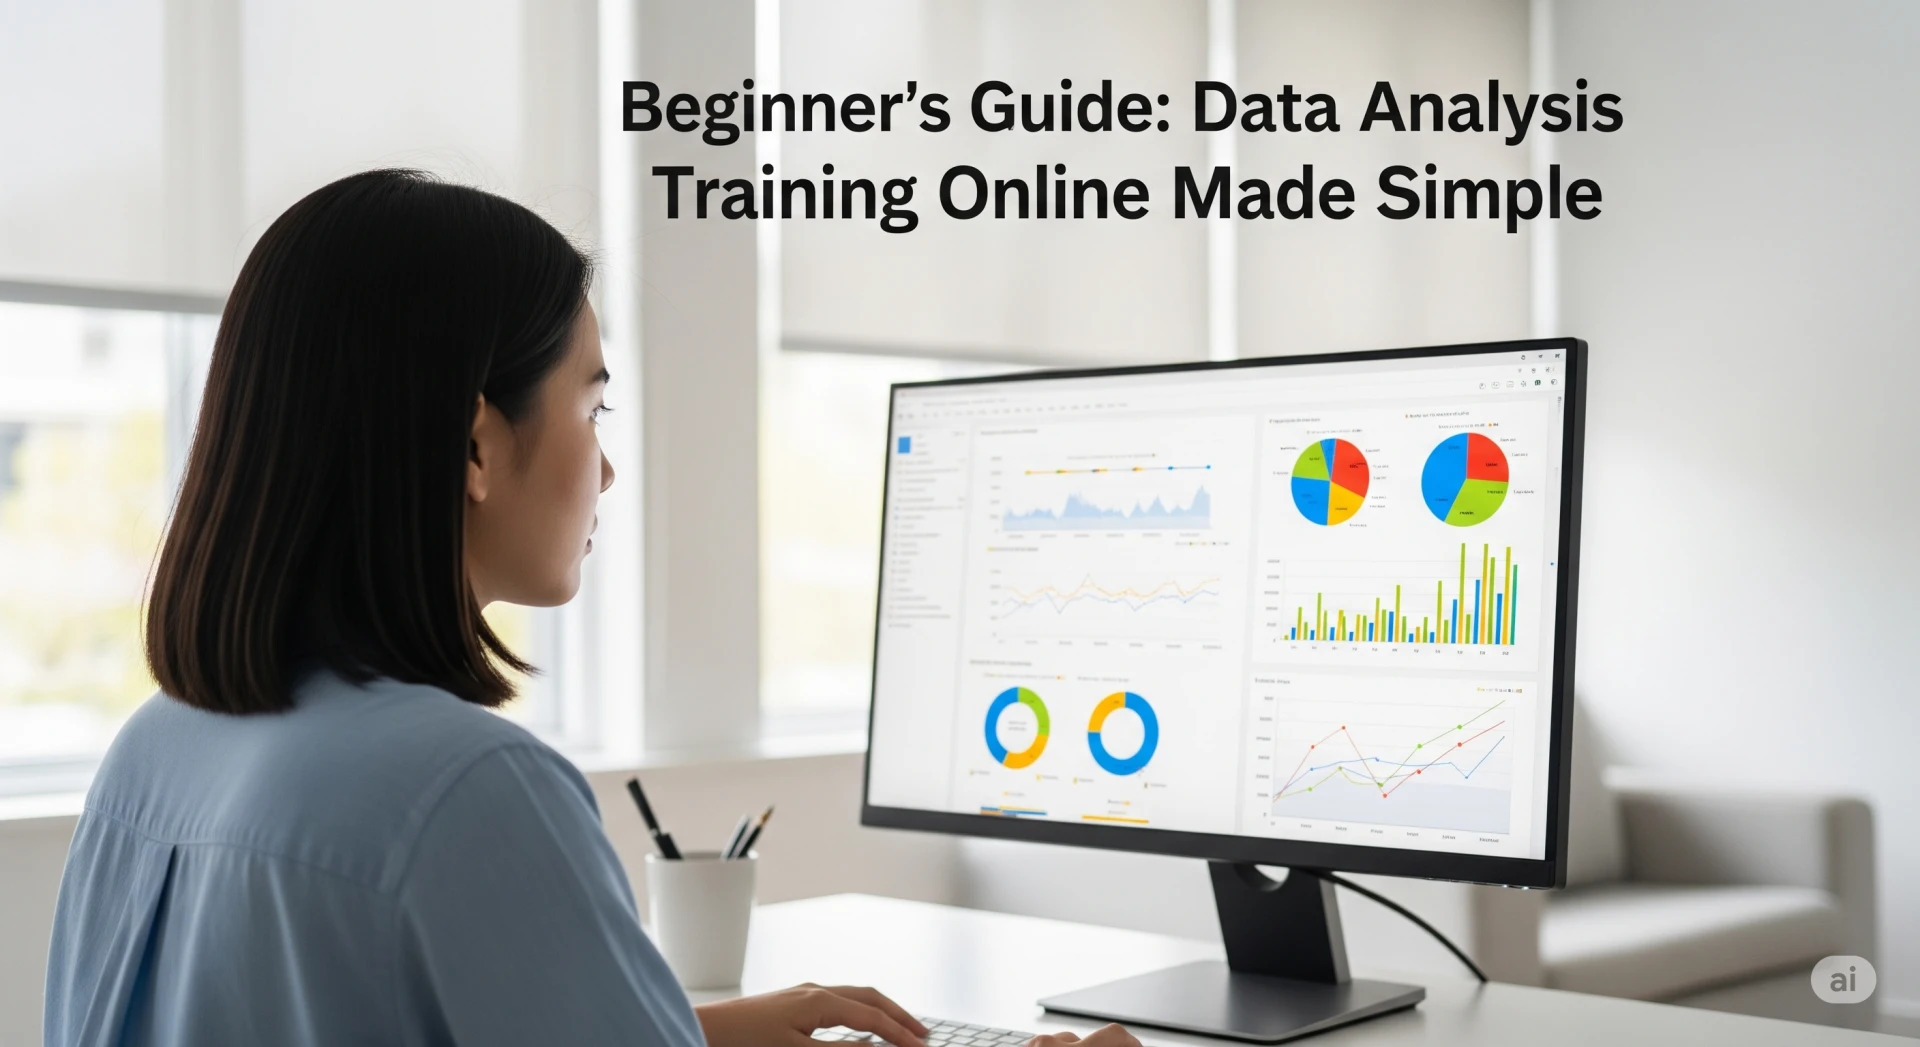
Visualising Data Trends
In simple words, visualising data trends means turning numbers into charts or graphs for better understanding. Instead of focusing on numbers, you can look at the bar graphs and line graphs to understand what's actually happening. SPSS provides the basics of visualisation under the graphs and chart builder.
On the other hand, R claims more flexible and advanced visuals by using libraries such as ggplot2. In this, you can also customise your graphs. Moreover, good charts do not make your data understandable. They assist you by telling a story. If you want to address this topic in your essay, seek support from an essay typer.
Interpreting Statistical Results
It means learning what numbers are from your analysis and what they actually are in real-world terms. Additionally, it's not just about getting the p-value. Suppose you have a value of 0.3, then you know that the difference is statistically significant, but do you think the difference is meaningful in practice? To answer this, you need to see the effect sizes and know the statistics. SPSS provides detailed result that guides you in interpreting your results.
It bridges the gap between data and insights.
These steps will help you learn how to use SPSS and R effectively for psychological research.
Conclusion
As you know, analysing psychological data effectively involves more than simply running tests. Tools such as SPSS and R are the most standard and beneficial ways to support data. Further, if you want to learn more about SPSS or R, you can seek guidance from university assignment help experts. This piece has discussed the steps to analyse data using SPSS or R. Hopefully, this guide has helped you make the process of analysing data clearer.
Also Read: How to Build Learning Habits in a Fast-Changing Knowledge World?


Sign in to leave a comment.