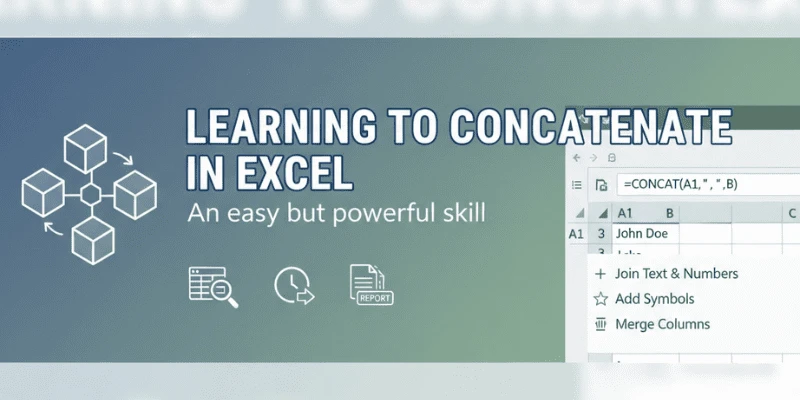
I’ll never forget the Friday I inherited a 27-tab workbook from a colleague who’d left the company two weeks earlier. Each tab had slightly different column names, dates in four formats, and a few cells that looked suspiciously like manual edits. I spent the afternoon teaching myself and my weary brain how to concatenate in Excel, use better excel formulas, and stitch those tabs into a single, sane dataset. That scramble was a reminder: MS Excel is still the duct tape of modern data work. But in 2025, it’s doing a lot more than just holding things together.
If you’re wondering what’s changed in excel data analysis this year and what skills to invest in if you’re trying to learn Excel or level up to advanced Excel read on. I’ll walk through the trends I’m seeing in teams big and small, share practical examples (no corporate buzzword salad), and point you toward the next things to practice in your own excel spreadsheets.
1. AI-assisted spreadsheets: your new pair-programmer
This year, the biggest surprise isn’t a single flashy feature it’s the way AI is being woven into everyday excel tutorial workflows. Expect features that suggest formulas, rewrite messy data-cleaning steps as Power Query scripts, or recommend excel templates based on the data pattern you upload.
Practical example: instead of hunting for the right excel functions to extract a date buried in a text string, modern assistants can suggest the formula and show how to wrap it in error-handling. It’s like having a patient colleague who never gets annoyed when you ask, “How do I split this column again?”
Why it matters: AI reduces friction for beginners trying to learn excel, and it accelerates expert analysts by removing repetitive decision-making. The trade-off is knowing when to trust the suggestion human judgment still matters.
2. Power Query & automation become table-stakes
Power Query has matured from a cool add-on to a core tool for repeatable ETL inside Excel. In 2025, more teams treat Power Query scripts as production assets version-controlled, documented, and reused across reports.
Story moment: I once turned a three-hour monthly report into a 10-minute refresh by standardizing every source in Power Query. The CFO cheered. I took a victory lap.
What to learn: build a small library of transformation steps (split columns, parse dates, unpivot tables) and save them as excel templates. Knowing how to automate even simple tasks separates someone comfortable with spreadsheets from someone doing true excel data analysis.
3. Advanced Excel functions that replace scripting for many tasks
Functions like dynamic arrays, XLOOKUP, LET, and LAMBDA have continued to reduce the need for external scripts for a lot of analytical work. LAMBDA, in particular, lets you build reusable, named functions inside Excel which means elegant solutions for recurring logic without touching VBA.
Tip: use LET to simplify complex excel formulas so they’re readable and performant. Wrap repeated calculations into named LAMBDA functions and you’ll find your spreadsheets become easier to audit.
4. Better collaboration: spreadsheets that behave like apps
Spreadsheets are no longer solitary files hidden on someone’s desktop. With cloud-backed MS Excel and collaborative features, multiple contributors can work on the same excel spreadsheets, leave comments, and co-author in real time. Integration with platforms like Teams and Slack makes insight sharing instantaneous.
Caveat: collaboration brings governance challenges. If you’re in a team, standardize your excel templates and naming conventions before chaos arrives.
5. Data visualization that tells stories not just charts
Business stakeholders are demanding clarity. That means dashboards built with storytelling in mind, combining sparklines, conditional formatting, and well-designed PivotCharts (or connected BI visuals when necessary). Excel remains a great prototyping tool for dashboards before you push to a BI platform.
How I approach it: start with a single question your dashboard should answer. Design around that question, then use PivotTables and clean excel templates to keep the visuals consistent.
6. Interoperability: Excel as the bridge, not the island
Excel’s role is evolving into that of a universal translator importing CSVs, pulling from APIs, handing cleaned data off to Python or Power BI. More teams pipe raw data through Excel as a quick sanity-check before committing it to a database or model.
Example: export a cleaned table from Power Query, run a quick analysis in Excel to validate, then push the final table to your analytics platform. It’s faster and keeps non-technical stakeholders in the loop.
7. Skills employers want in 2025: the practical mix
If you’re building a career in IT or analytics, here’s a sensible skills checklist that hiring managers ask about:
· Solid mastery of excel formulas and excel functions (XLOOKUP, INDEX/MATCH, dynamic arrays).
· Comfort with Power Query and building reusable transformations.
· Ability to build clear dashboards and use excel templates thoughtfully.
· Familiarity with automation macros, or scripting via LAMBDA/VBA and when to pass to Python.
· Hands-on experience with collaborative, cloud-based MS Excel workflows.
If you need a starting point, follow a practical excel tutorial that walks you through a real dataset end-to-end from messy import to analytical insight.
8. Security, governance, and ethical use
With greater power comes a need for controls. Organizations in 2025 are treating spreadsheet governance seriously: access controls, audit trails, and checks to avoid accidental data leaks. Don’t be the person who sends a sensitive excel spreadsheets file to the wrong distribution list set up permissions and adopt secure excel templates.
Conclusion what to do this week
Pick one small project: take a messy CSV, concatenate in Excel where needed, clean it in Power Query, and build a one-page report. Along the way, practice a new excel function (LET or LAMBDA if you’re ready). If you’re mentoring someone, give them an excel tutorial that’s less about commands and more about decisions: “Why did we unpivot here?” That’s the mental model that separates power users from spreadsheet clerks.
Excel in 2025 is not relic or replacement it’s a hub. Get comfortable with the new assistants, automate repetitious work, and keep your foundation in excel formulas and advanced excel practices strong. Do that, and you’ll be prepared for whatever the spreadsheets (or the data) throw at you next.


Sign in to leave a comment.