Introduction to Created vs Resolved Charts
A Created vs Resolved chart in Jira is an Agile reporting tool that compares the number of issues being created with the number of issues being completed over time. It helps teams understand whether incoming demand is balanced with delivery capacity.
Inside Jira, this chart is commonly used for monitoring workload trends, backlog growth, and overall system stability.
What the Chart Actually Shows
The Created vs Resolved chart visualizes two key data streams:
Created issues — new work entering the system
Resolved issues — work completed and delivered
By comparing these two trends over time, teams can immediately see whether they are keeping up with incoming demand or falling behind.
How to Read the Chart
The chart typically uses two lines:
A line representing newly created issues
A line representing resolved issues
The relationship between these lines is critical:
If created > resolved, the backlog is growing
If resolved > created, the backlog is shrinking
If both lines are aligned, the system is balanced
This simple comparison provides powerful insight into workflow health.
Key Insights from Created vs Resolved Charts
This chart helps teams understand several important aspects of delivery:
Whether incoming work exceeds team capacity
How backlog size is changing over time
Whether process improvements are effective
How stable demand vs delivery is across periods
Early signals of overload or underutilization
It acts as an early warning system for delivery imbalance.
Backlog Growth and System Pressure
One of the most important use cases of this chart is monitoring backlog growth. When the created line consistently stays above the resolved line, it indicates that work is accumulating faster than it is being completed.
Over time, this can lead to:
Increased cycle times
Lower predictability
Higher workload pressure on teams
Reduced ability to plan effectively
Conversely, a stable or shrinking backlog suggests a healthy delivery flow.
Using the Chart for Capacity Planning
Created vs Resolved charts are also useful for understanding team capacity. By analyzing long-term trends, teams can:
Evaluate whether staffing levels are sufficient
Adjust sprint scope based on real throughput
Identify periods of overload or underutilization
Align demand intake with delivery capability
This makes the chart valuable for both team-level and portfolio-level planning.
Common Patterns in Real Projects
Several typical patterns can be observed in Jira environments:
Diverging lines → growing backlog and delivery imbalance
Parallel lines → stable system with balanced flow
Crossing lines → recovery or shift in capacity
Volatile patterns → inconsistent intake or unstable workflow
These patterns help teams quickly diagnose system behavior.
Limitations of Created vs Resolved Charts
While useful, this chart also has limitations:
It does not show cycle time or work aging
It lacks detailed workflow stage visibility
It cannot explain why imbalance occurs
It may hide bottlenecks inside the system
It focuses on input/output, not internal flow
Because of this, it is often used together with other Agile charts for deeper analysis.
Conclusion
Created vs Resolved chart in Jira is a simple but powerful tool for understanding the balance between incoming work and delivered output. By comparing demand and delivery over time, teams can quickly identify backlog growth, capacity issues, and workflow imbalance.
When used alongside other analytics in Jira, it becomes an important part of a broader Agile reporting system that supports predictable and sustainable delivery.

Created vs Resolved Chart in Jira: Tracking Work Intake and Delivery Balance
iDeals Virtual Data Room: The Gold Standard in Secure Deal Management (2025 Edition)In a world where a single data breach can cost hundreds of million
More from vased
View all → Android
Toggle VPN: The App That Cured My VPN Fatigue in 2025
 Android
Trinetix: Where Enterprise-Scale Engineering Meets Product Thinking
 Android
Prefabricated Storage Sheds: A Comprehensive Guide
Similar Reads
Browse topics →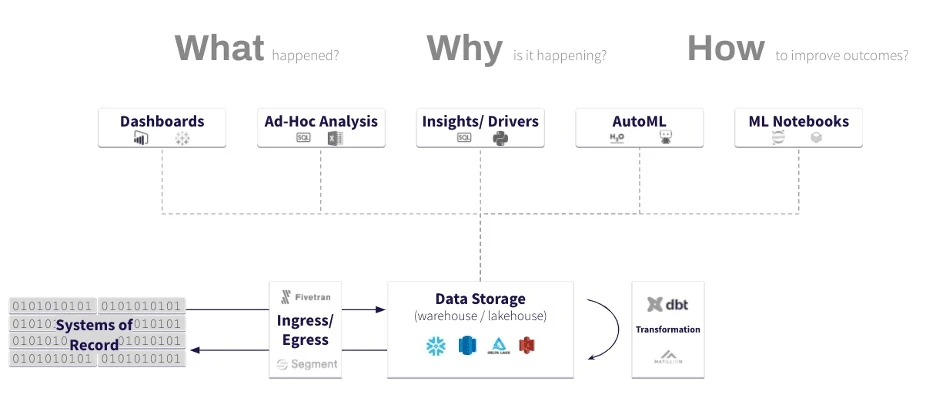
Navigating the Gartner Magic Quadrant for Analytics: A Closer Look at Te…
Unlock Your Website's Revenue Potential: A Deep Dive into the Adsterra A…

How to start a blog and make money online (Step by Step Beginners Tutori…

Travelpayouts Review: The Ultimate Travel Affiliate Marketing Platform i…

How Emojis Became the Secret Language of the Heart

How To Make Money Blogging in 2025 ( Your Complete Guide )

Ezoic Review: Pros, Cons and How to Increase your Ad Revenue by 200%.

How AI-Powered Predictive Analytics is Transforming Customer Insights

How ESG Tokenization Is Shaping Profitable and Sustainable Investment Op…
More in Blogging
Browse all in Blogging → Blogging
Cipro CF Cream Explained: Uses, Dosage, Precautions, and Benefits
 Blogging
Master Your Ride: Understanding, Diagnosing, and Replacing the Steering …
 Blogging
온라인 홀덤 가이드북
 Blogging
Why Does Semiquincentennial History Matter in 2026?
 Blogging
Cooley Retractor — Precision Retraction for Cardiovascular and General S…
 Blogging
Latest Govt Jobs in Punjab: A Complete Career Guide for Aspirants
Sign in to leave a comment.