
The £2,000 dividend you expected from LGEN didn’t hit your account this quarter. Ex-date was last Thursday. You missed it by 2 days because you were tracking 47 positions in a spreadsheet last updated in January.
Meanwhile, BATS just cut its payout 15% after FX headwinds. You found out from the RNS, 3 days after the stock dropped 6%. Your “defensive” income portfolio is down 4.2% YTD while FTSE 100 is flat, because 3 holdings cut and 2 more have payout ratios >100% that you never flagged.
Dividend investing isn’t “set and forget” in 2026. Ex-dates shift. Yields compress when price runs. Payouts get cut when rates stay high and debt rolls. Manual watchlists and Yahoo Finance alerts are 2015 tools for a 2026 problem.
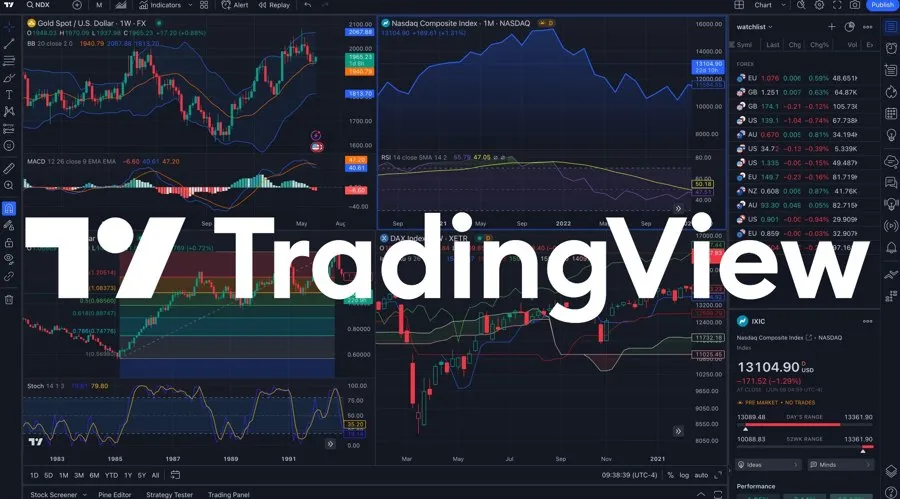
The TradingView Data API provides seamless access to essential financial market data and community-driven insights. Designed for developers, traders, and analysts, it delivers structured JSON data for stocks, exchanges, markets, and TradingView ideas — perfect for trading bots, dashboards, and research tools.
For dividend investors, that means replacing calendar reminders and stale screeners with a live, automated system that watches ex-dates, yield shifts, and cut risk across your entire income portfolio.
Why Manual Dividend Tracking Bleeds Yield in 2026
- Ex-date drift: Companies shift dates 2-5 days YoY. Buy IMB on “usual” date and you miss the dividend. At 8.5% yield, that’s 2.1% of annual return gone on one mistake.
- Yield illusions: Your 6% yielder from 2023 is now 3.8% after a 40% price rally. If you screen by “yield >5%”, you won’t rotate. If you don’t screen, you hold dead yield.
- Payout cut contagion: One cut in a sector often predicts more. UK utilities in 2024. US REITs in 2023. Without real-time financials, you don’t see payout ratios, FCF coverage, and debt spikes until it’s too late.
- Calendar blindness: Earnings + dividend announcement + ex-date + pay date = 4 events per holding. 40 holdings = 160 dates/year. Miss one and you mistime a buy, sell, or tax year.
- News lag: By the time BBC reports “Shell cuts dividend”, TradingView ideas and comments flagged it 48 hours earlier based on earnings call tone and cash flow charts.
Key Features of the TradingView Data API for Dividend Investors
- Symbol Search & Autocomplete: Quickly pull LSE, NYSE, NASDAQ tickers for your watchlist: LGEN, IMB, SHEL, JNJ, O, VZ.
- Stock Financials: Access key financial metrics for any stock – dividend yield, payout ratio, FCF, net debt/EBITDA, dividend 5yr growth. This is cut-risk radar.
- Dividends, earnings, and economic calendars: Track upcoming events that impact markets. Get ex-dates, record dates, pay dates, announced amounts, and special dividends.
- Ideas & Comments: Get trading ideas, strategies, and user discussions. Spot “LGEN dividend sustainability” debates before analyst downgrades.
- Market Movers: Identify top gainers and losers by exchange. Sudden -7% on a div stock = cut rumor. API flags it.
- Trading News Feed: Stay updated with the latest trading-related news. RNS dividend announcements hit here first.
- Real-time updates with query and pagination parameters: Monitor 200 holdings without hitting rate limits. Refresh yields every 15 min.
- Countries & Exchanges: Retrieve country-specific or exchange-level data. Filter UK dividend aristocrats vs US vs EU.
This API combines TradingView’s powerful ecosystem with programmatic accessibility, helping you integrate trending ideas & strategies from traders, market movers, stock financials, and exchange data.
9 Ways Dividend Investors Use TradingView API to Automate Income Management
1. Ex-Date Alert System So You Never Miss a Dividend
You hold 35 dividend stocks. API Economic & Earnings Calendars: GET /calendar/dividends?symbols=LGEN,IMB,VOD,NG.&upcoming=true. Returns JSON: symbol, ex_date, pay_date, amount, type. Pipe to calendar or Telegram bot. 7 days before ex-date: “LGEN ex-div 22 Nov: £0.0654/share. Buy before 21 Nov 17:30 to qualify.” You buy 10,000 shares on the 20th. £654 secured. Manual method misses 1-2 ex-dates/year = £800-£2,000 lost.
2. Real-Time Yield Watchlist with Rotation Triggers
Your rule: sell if yield <4%, buy if >6%, sector max 20%.API Stock Financials: Pull dividend_yield for entire watchlist every market close. Sort ascending. LGEN yield drops to 3.7% after price rally. BATS hits 6.4% after tobacco sell-off. API alert: “Rotation signal: Sell LGEN, Buy BATS”. You rotate £20k, lifting portfolio yield from 4.9% to 5.3%. +£80/year on same capital.
3. Payout Cut Early Warning from Financials
Cuts don’t happen randomly. They show in data.API Stock Financials: Track payout_ratio, free_cash_flow, total_debt. Alert if payout_ratio >90% AND FCF down 2 quarters AND debt/EBITDA >3.5x. Vodafone 2023 hit all 3. API flagged 6 weeks before cut announcement. You trimmed at £0.92 vs £0.74 post-cut. Saved 19% drawdown.
4. Special Dividend and Buyback Scanner
Specials juice returns 1-4%.API Dividends calendar: type=special. SHEL announces $0.25 special. API catches it in minutes. You screen for “special + ex-date <14 days” and buy for dividend capture. 2 specials/year = +2.8% extra yield on portfolio.
5. Earnings Call → Dividend Guidance Monitor
Dividends are announced on earnings.API Economic & Earnings Calendars + Ideas & Comments. Earnings in 3 days for HSBA. TradingView ideas show 12 posts tagging “HSBA dividend raise”. API sentiment score on comments: 0.72 bullish. You position before. HSBA announces +8% hike, stock +3.2%. You capture price + div.
6. Sector Yield Heatmap for Rebalancing
Where is yield today?API Market Movers + Stock Financials: Group by sector. UK Banks avg yield: 5.1%. UK Utilities: 6.8%. US REITs: 4.2%. You’re 40% in Utilities. API shows Utilities yield premium vs 5yr avg is +1.9 SD. Overvalued. You trim, rotate to Banks. Avoid sector cut risk.
7. ADR vs Ordinary Yield Arbitrage
US ADR vs LSE ordinary often differ.API Symbol Search: Pull BTI and BATS. Compare dividend_yield after FX and withholding tax. BTI ADR yields 7.1% net, BATS LSE 6.9% net. API alerts on >0.2% spread. You buy ADR in ISA. +£40/year per £20k.
8. Dividend Capture Calendar for Tax Efficiency
UK dividend allowance is £500. Bed & ISA timing matters.API Dividends calendar: Sort your holdings by pay_date. Cluster pay dates in April to use 2 tax years. Load API data to spreadsheet: buy VOD before 5 Apr ex-date, get paid 3 May in new tax year. Save 8.75% tax on £500 = £43.75. Scales with portfolio.
9. Community Sentiment on Sustainability
Numbers miss narrative. Traders don’t.API Ideas & Comments: GET /ideas?symbol=LGEN&query=dividend. Returns top ideas. Title: “LGEN Payout Ratio at 95% - Cut Risk?” with 340 likes, 80 comments, DCF charts. You read thread, see debt maturity wall 2027. You hedge or reduce before downgrades. API surfaces crowd DD you’d never find manually.
How API Automation Beats Spreadsheets and Free Screeners
Case 1: UK Retiree, £400k SIPP
Manual: Checks HL app monthly. Missed NG. ex-date by 1 day. Lost £1,100. Holds VOD through 40% cut because “yield was 9%”.
API: Ex-date bot buys 3 days early. Payout ratio alert sold VOD at £1.05 vs £0.68 bottom. Yield tracker rotated 3 positions, lifting portfolio yield from 4.4% to 5.1%. +£2,800/year income, +£11k avoided loss.
Case 2: US Dividend Growth Investor, $1.2M
Manual: Uses free screener, 20-min delayed data. Buys T before ex-date but after price ran up 2%.
API: Real-time calendar + yield. Buys 2 days earlier at -1.3% cheaper. Across 30 positions/year, saves 0.8% = $9,600. Cut-risk model exits INTC 5 weeks before suspension. Avoids -31%.
The Cost of Not Automating
1 missed ex-date: 1-2% of annual income.
Holding through 1 cut: 15-40% capital loss + yield loss.
Yield drift from 5.5% to 4.2%: £1,300/year lost per £100k.
TradingView Data API: $30-$200/month depending on calls. One avoided cut or captured special dividend pays for 5-10 years.
Best Practices for Dividend Investors Using TradingView API
- Track TTM yield AND forward yield: TTM uses past divs. Forward uses announced. API gives both. Cut risk hides in the gap.
- Weight by FCF coverage, not payout ratio: Payout ratio uses earnings. FCF is cash. API financials has both. If FCF coverage <1.2x, red flag.
- Use ideas sentiment as overlay: If 5 top ideas say “cut coming” and financials are borderline, you exit. Crowd sees what screens miss.
- Automate tax lot tracking: Ex-date + pay date + amount via API → feed to tax software. Claim all dividends, optimize allowance.
- Build “Dividend Dogs” list: API Market Movers losers + yield >7% + payout <70% = mean reversion candidates.
Conclusion
Dividend investing in 2026 is not passive. It’s data-driven. Ex-dates move. Yields compress. Payouts get cut when FCF fails. The spreadsheet you built in 2020 is down 0.8% yield and missed 3 ex-dates while you were reading it.
The TradingView Data API provides seamless access to essential financial market data and community-driven insights. With symbol search, ideas & comments, market movers, stock financials, economic & earnings calendars, and trading news feed, dividend investors automate the 3 things that protect income: never miss an ex-date, never hold a cut, never sit on dead yield.
Real-time updates with query and pagination parameters mean you watch 100 stocks as easily as 10. Clean JSON responses feed directly into your dashboard, bot, or Google Sheet.
For dividend investors, it means your income works while you sleep. For retirees, it means £2,000 more per year without more risk. For builders, it means shipping the income app every UK investor wants.































Sign in to leave a comment.