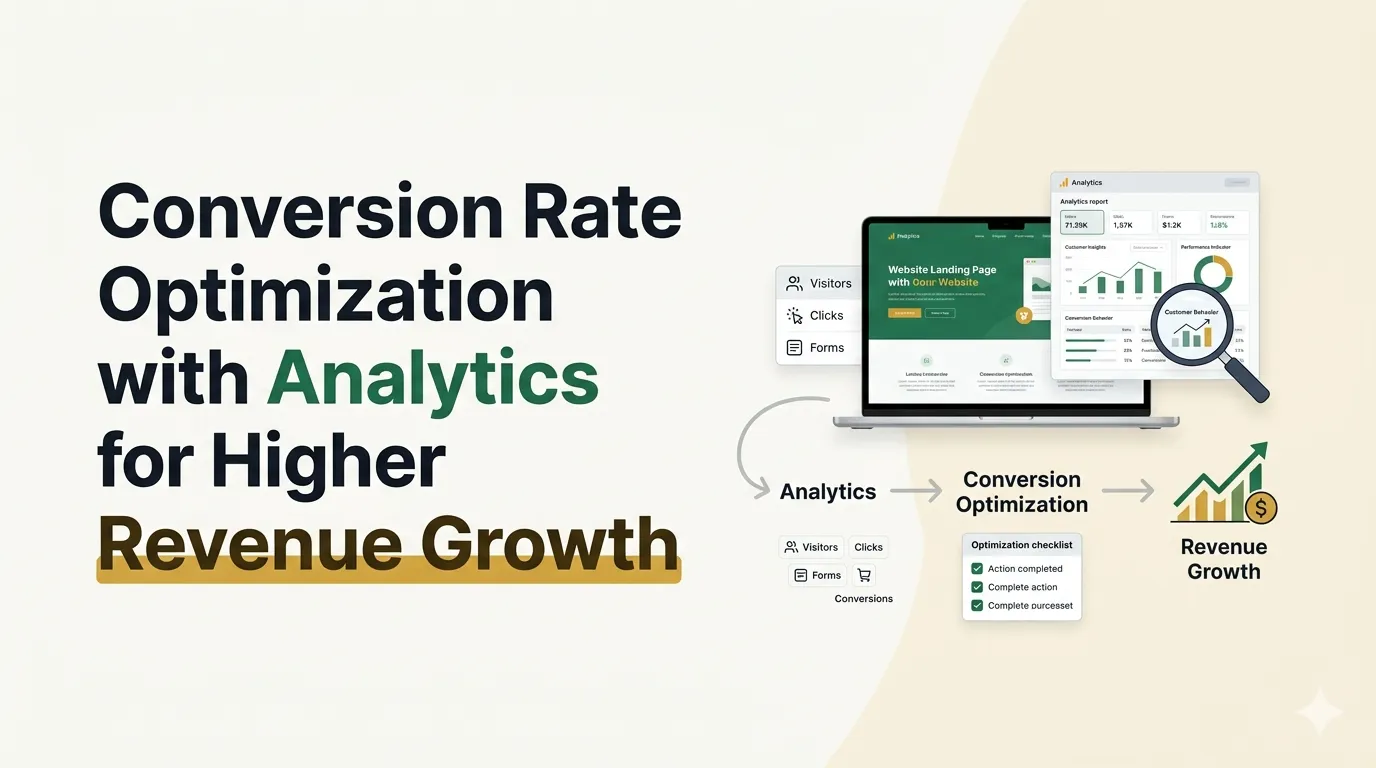

Conversion rate optimization analytics helps eCommerce teams replace guesswork with evidence. Rather than reacting to a falling conversion rate on a dashboard, CRO analytics combines GA4 funnel data with qualitative tools like heatmaps and session recordings to identify exactly where customers stop and why. This guide covers the full process from defining conversions to choosing the right platforms to running compliant, statistically valid tests, for marketing operations teams that want analytics to generate revenue, not just reports.
What Standard Analytics Gets Wrong
Most eCommerce teams run analytics. Few run it in a way that drives decisions. The typical setup tracks what users did, pages visited, sessions started, purchases completed, without explaining the behavior behind those numbers. A conversion rate decline shows up in the dashboard. The cause stays hidden.
The Problem With Descriptive Metrics
Page views, bounce rate, and average session duration describe outcomes. They do not explain decisions. A high bounce rate on a product page could mean slow load time, a broken image, a confusing price, or simply the wrong traffic. Descriptive metrics confirm that something went wrong. They offer no direction on what to fix.
What Diagnostic Analytics Does Instead
Diagnostic analytics asks why a specific user segment dropped off at a specific step. Krish applies the Krish Predictive Commerce Matrix to structure this work in three stages:
- Tracking: capturing reliable baseline behavior across the full purchase journey
- Diagnosing: identifying the exact step and segment where friction occurs
- Predicting: using machine learning to surface likely drop-offs before they affect revenue
This shift from reporting to diagnosis is the foundation of any serious AI strategy for retail. Teams that skip diagnostic work end up testing the wrong things, on the wrong pages, for the wrong reasons.
How to Run CRO Analytics That Actually Works
Structured process separates CRO programs that compound gains from ones that produce one-off wins. The four steps below give marketing operations teams a repeatable method that works across platforms and business models.
Step 1 — Define Conversions at the Macro and Micro Level
Every analysis starts with a clear definition of success. Macro conversions are primary business outcomes: a completed purchase, a contract signed, a lead submitted. Micro conversions are every measurable action a user takes to reach that goal.
Mapping this sequence tells you which step to prioritize when drop-offs appear. It also prevents teams from optimizing steps that are not actually causing revenue loss. Applying digital analytics to your eCommerce strategy only produces results when this conversion map exists first.
Step 2 — Identify the Biggest Funnel Leak in GA4
Open GA4 and go to Monetization > Ecommerce purchases. Build a custom Funnel Exploration that maps your actual checkout sequence step by step. Measure the completion rate at each transition and find the largest single drop.
That gap is the only problem worth solving first. Everything downstream is secondary until the primary leak closes. This prioritization approach sits at the center of sound conversion rate optimization best practices and prevents teams from spreading effort across too many variables at once.
Step 3 — Layer Qualitative Data to Understand the Cause
GA4 shows where users leave. Session recordings show what users experience when they leave. One apparel brand identified a 40% checkout drop in GA4, then used Hotjar recordings to trace it to a hidden promo code field on mobile. Users were leaving to search for discount codes rather than continue with checkout.
A single UX fix recovered the lost revenue. The same principle applies across platforms — teams that want to improve Magento cart conversion rates consistently find that qualitative data reveals causes the funnel numbers alone cannot.
Step 4 — Prioritize Fixes and Write Real Hypotheses
Once quantitative and qualitative data confirm a problem, use the PIE framework to decide what to address first:
- Potential: how much improvement is realistic if this friction point disappears?
- Importance: how much traffic and revenue does this step handle?
- Ease: how much development time does the fix require?
Write a specific, measurable hypothesis before building anything. Vague test ideas produce uninterpretable results. If your current analytics infrastructure cannot support this process, a MarTech stack audit will show exactly what is blocking you.
Choosing Platforms for CRO Analytics
No single tool covers every layer of CRO analytics well. The most effective programs combine a quantitative platform, a qualitative platform, and for enterprise teams, a personalization engine. Each serves a different function in the diagnostic process.
Quantitative Analytics
GA4 is the standard starting point for eCommerce CRO. It handles event tracking, cross-device measurement, and custom funnel explorations. Most marketing operations teams need nothing more at the quantitative layer until traffic volume and complexity grow significantly.
Mixpanel adds depth for products with complex, multi-step user journeys. It handles cohort analysis and long-term retention tracking better than GA4. It suits B2B platforms and subscription products more than standard retail checkout environments.
Qualitative Analytics
Hotjar records how real users move through real pages. Heatmaps show where attention lands. Scroll maps show how far users read. Session recordings show the exact moment abandonment happens and what came immediately before it. Use Hotjar after GA4 points you toward a specific problem — not as a general research tool.
AI-Driven Personalization
Dynamic Yield uses machine learning to serve personalized content, product recommendations, and offers based on live user behavior rather than historical averages. Enterprise retailers use it when manual A/B testing can no longer scale to match the complexity of their audience and catalog.
The Honest Limits of CRO Analytics
CRO analytics improves what is already working. It does not fix underlying structural problems. A site with a six-second load time, a non-functional mobile checkout, or fundamentally misaligned product pricing will produce accurate data about its own failure, but no analytics tool will resolve those root causes.
Low Traffic Breaks A/B Testing
Split tests require enough visitors to reach statistical significance. Pages or categories with a few hundred monthly visitors cannot generate reliable results before external conditions change. In these situations, heuristic UX audits and structured interviews with real customers produce more useful findings than any quantitative test.
CRO Analytics Takes 60 to 90 Days to Show Results
Teams that expect results in two weeks consistently make decisions on incomplete data. A realistic timeline looks like this:
- Weeks 1 to 4: configure GA4 custom events, run session recordings, and establish a behavioral baseline
- Weeks 5 to 8: launch hypothesis-driven A/B tests and hold each until it reaches 95% statistical significance
- Weeks 9 to 12: analyze confirmed outcomes, document learnings, and roll out validated improvements
Skipping the baseline phase or cutting tests short generates false positives that send optimization in the wrong direction.
Privacy Regulations Affect Data Collection Directly
GDPR and CCPA restrict what behavioral data teams can collect and how they store it. Client-side cookie tracking delivers incomplete data for an increasing share of users. Server-side tracking and a consent management platform fill this gap while protecting the business from legal exposure. Build this infrastructure before deploying CRO tooling, retroactive fixes create gaps in historical data that undermine analysis.
Where CRO Analytics Heads Next
Manual A/B testing answers specific, well-scoped questions effectively. The broader direction in eCommerce is toward AI systems that process behavioral signals continuously and adjust user experiences in real time, without the delay of a test cycle. These systems do not replace structured CRO work. They build on the data foundation that structured CRO work creates.
Teams focused on mobile eCommerce conversion optimization need clean, composable data infrastructure today to integrate these systems as they mature. Brands that defer this infrastructure work will find the gap between themselves and AI-ready competitors difficult to close quickly.
The full framework, covering every stage from funnel mapping through predictive personalization, is documented in the analytics and conversion rate optimization playbook.
Conclusion
Data without action has no business value. For over 20 years, Krish has built platform-agnostic commerce architectures that connect behavioral analytics to revenue outcomes for enterprise brands. Whether the goal is closing a checkout leak or scaling toward real-time personalization, our CRO team builds the frameworks that turn traffic into consistent, measurable growth.





























Sign in to leave a comment.