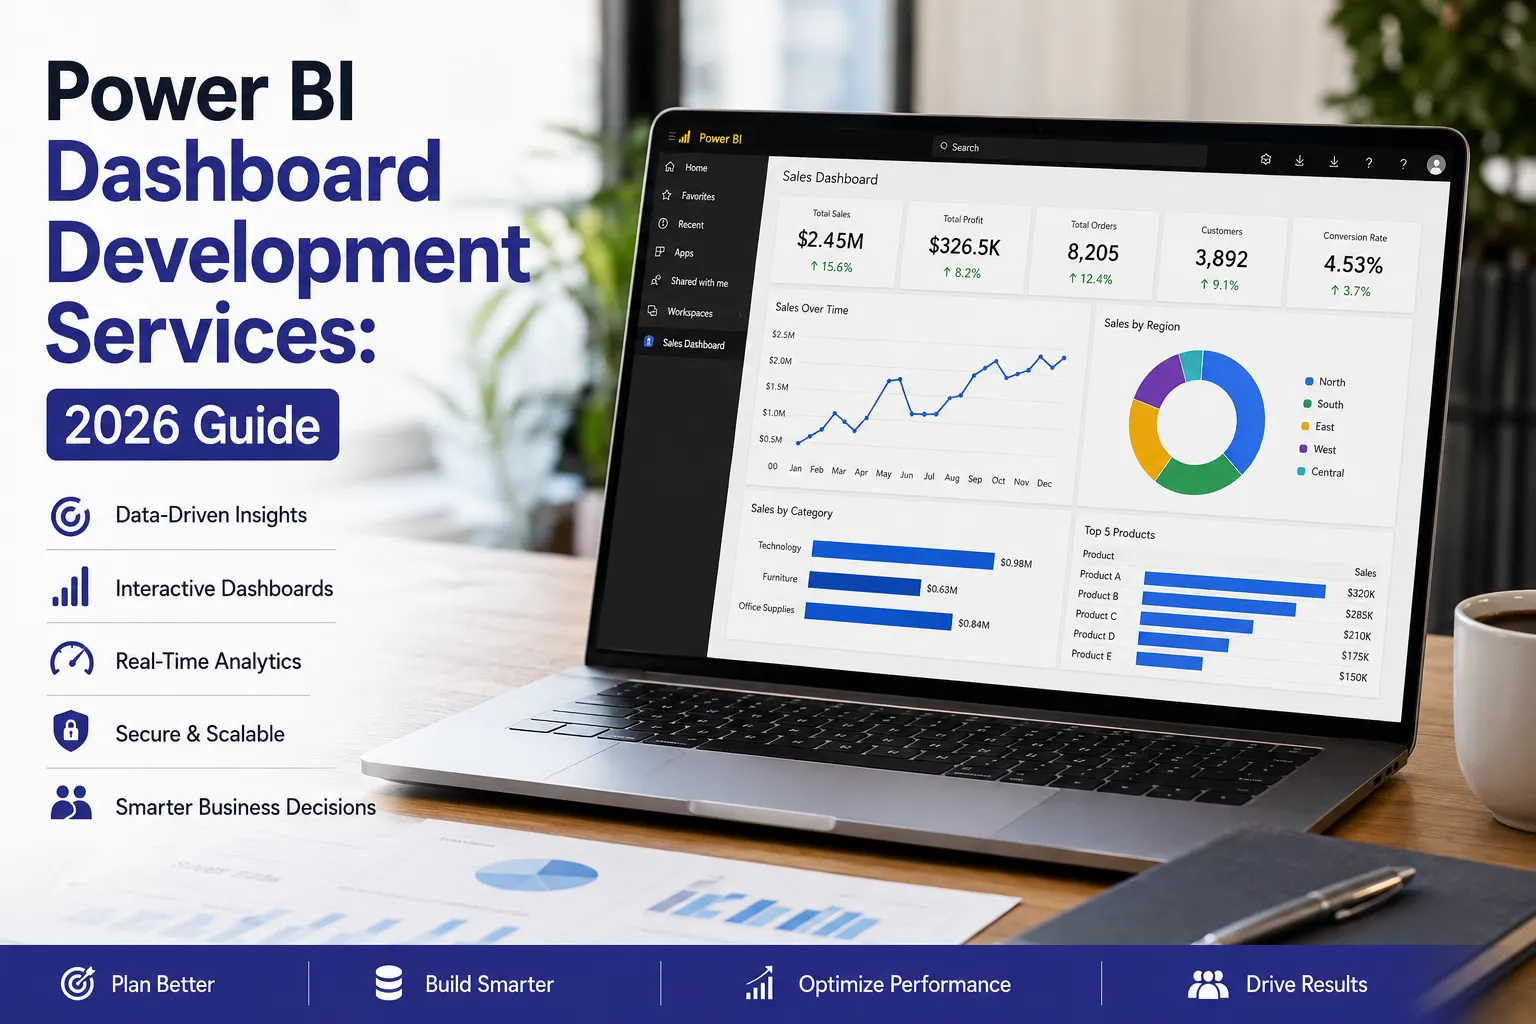
Is your business collecting large volumes of data but still struggling to turn it into clear insights? Do teams spend more time preparing reports than making decisions? This is where Power BI dashboard development services bring real value.
In 2026, organizations are focusing on speed, clarity, and real-time visibility. Traditional reporting is no longer enough. Businesses now rely on modern dashboard development services to convert raw data into interactive, easy-to-understand dashboards that support faster and smarter decisions.
At Dream IT Consulting Services, the focus is on building solutions that are not only visually effective but also aligned with business goals. This guide explains how dashboards are planned, built, and optimized—along with key trends shaping Power BI in 2026.
Key Takeaways
- Clear planning ensures dashboards align with business objectives
- A strong data model improves performance and accuracy
- Simple design enhances user adoption
- Optimization is essential for speed and scalability
- Structured deployment supports long-term success
Dashboards vs Reports in Power BI
In Power BI, dashboards and reports serve different purposes.
Dashboards
- Single-page view
- Focus on key metrics
- Designed for quick decision-making
Reports
- Multi-page and detailed
- Support deep analysis
- Include filters, slicers, and drill-down features
Basic Structure:
Dataset → Report → Dashboard
The dataset is the foundation where data is prepared. Reports allow detailed analysis, while dashboards present the most important insights in simplified format.
Experienced Power BI consulting firms ensure each layer is optimized for both usability and performance.
Planning Your Dashboard
A well-structured dashboard always starts with proper planning. Without it, even the best tools can lead to unclear results.
Before development begins, it is important to understand business requirements, users, and decision-making needs.
Key Planning Steps:
Define KPIs
Identify the most important metrics such as revenue, growth, or operational performance.
Identify Data Sources
Bring together data from CRM systems, databases, cloud platforms, or spreadsheets.
Set Refresh Frequency
Decide whether data updates should be real-time, hourly, or scheduled.
Design for Usage
Plan layouts based on how users will access the dashboard.
Establish Governance
Define ownership for maintenance, updates, and data accuracy.
With a clear plan, Power BI dashboard development services can deliver more effective and scalable solutions.
Building a Strong Data Foundation
Once planning is complete, the next step is creating a reliable dataset and report structure. This stage ensures that dashboards deliver accurate and fast insights.
Core Components:
Data Modeling
Use structured models to improve performance and simplify relationships.
DAX Measures
Create efficient calculations for KPIs and metrics.
Data Cleaning
Ensure consistency and remove errors from raw data.
Choosing Data Mode
- Import mode for speed
- DirectQuery for real-time needs
Report Development
Build interactive reports with clear visuals and navigation.
Publishing
Deploy reports to Power BI Service for sharing and dashboard creation.
Strong implementation ensures long-term scalability and reliability.
Designing Dashboards That Drive Action
Good design makes dashboards easier to understand and use.
Best Practices:
- Highlight key metrics clearly
- Keep layouts simple and structured
- Avoid unnecessary visuals
- Use consistent formatting
- Focus on actionable insights
At Dream IT Consulting Services, dashboards are designed with the end user in mind, ensuring clarity and usability.
Power BI Trends to Watch in 2026
As businesses evolve, Power BI continues to introduce new capabilities. Here are some key trends shaping dashboard development in 2026:
AI-Powered Insights
Built-in AI features help users identify trends, anomalies, and forecasts automatically.
Real-Time Analytics
More organizations are adopting streaming data for instant decision-making.
Microsoft Fabric Integration
Deeper integration with Microsoft Fabric enables better data management and unified analytics.
Self-Service BI Expansion
Business users are increasingly building and customizing their own reports with minimal technical support.
Improved Data Governance
Stronger focus on data security, access control, and compliance.
Staying updated with these trends helps businesses get more value from their data investments.
Performance Optimization and Deployment
Performance plays a critical role in user experience. Slow dashboards can reduce adoption and trust.
Optimization Techniques:
- Remove unnecessary data fields
- Use aggregated tables
- Apply incremental refresh
- Limit heavy visuals
Deployment Approach:
- Development environment
- Testing environment
- Production environment
Leading Power BI consulting firms also implement governance practices to ensure secure and efficient data usage.
Final Thoughts
Data becomes powerful only when it is easy to understand and act upon. Modern dashboards help businesses move from manual reporting to real-time insights.
By leveraging Power BI dashboard development services and working with experienced Power BI consulting firms, organizations can improve decision-making, efficiency, and overall performance.


Sign in to leave a comment.