Power BI Architecture is the backbone of Microsoft’s business intelligence system. It helps organizations transform data into insights. Power BI is a simple yet powerful framework that encompasses all data science tasks, from data ingestion to transformation and modeling to data visualization, in a single platform.
According to Market.us, Power BI has surpassed 100,000 corporate customers. Its growth is fueled by the retirement of "Premium P-SKUs" in favor of Microsoft Fabric, which integrates BI, data engineering, and data science into one unified SaaS platform.
If you want to make your data science workflows efficient and seamless, then an understanding of Power BI architecture can help you build secure and high-performance analytics models easily. Let us dive deeper and try to understand what it is, what its essential components are, and how it works.
What is Power BI Architecture?
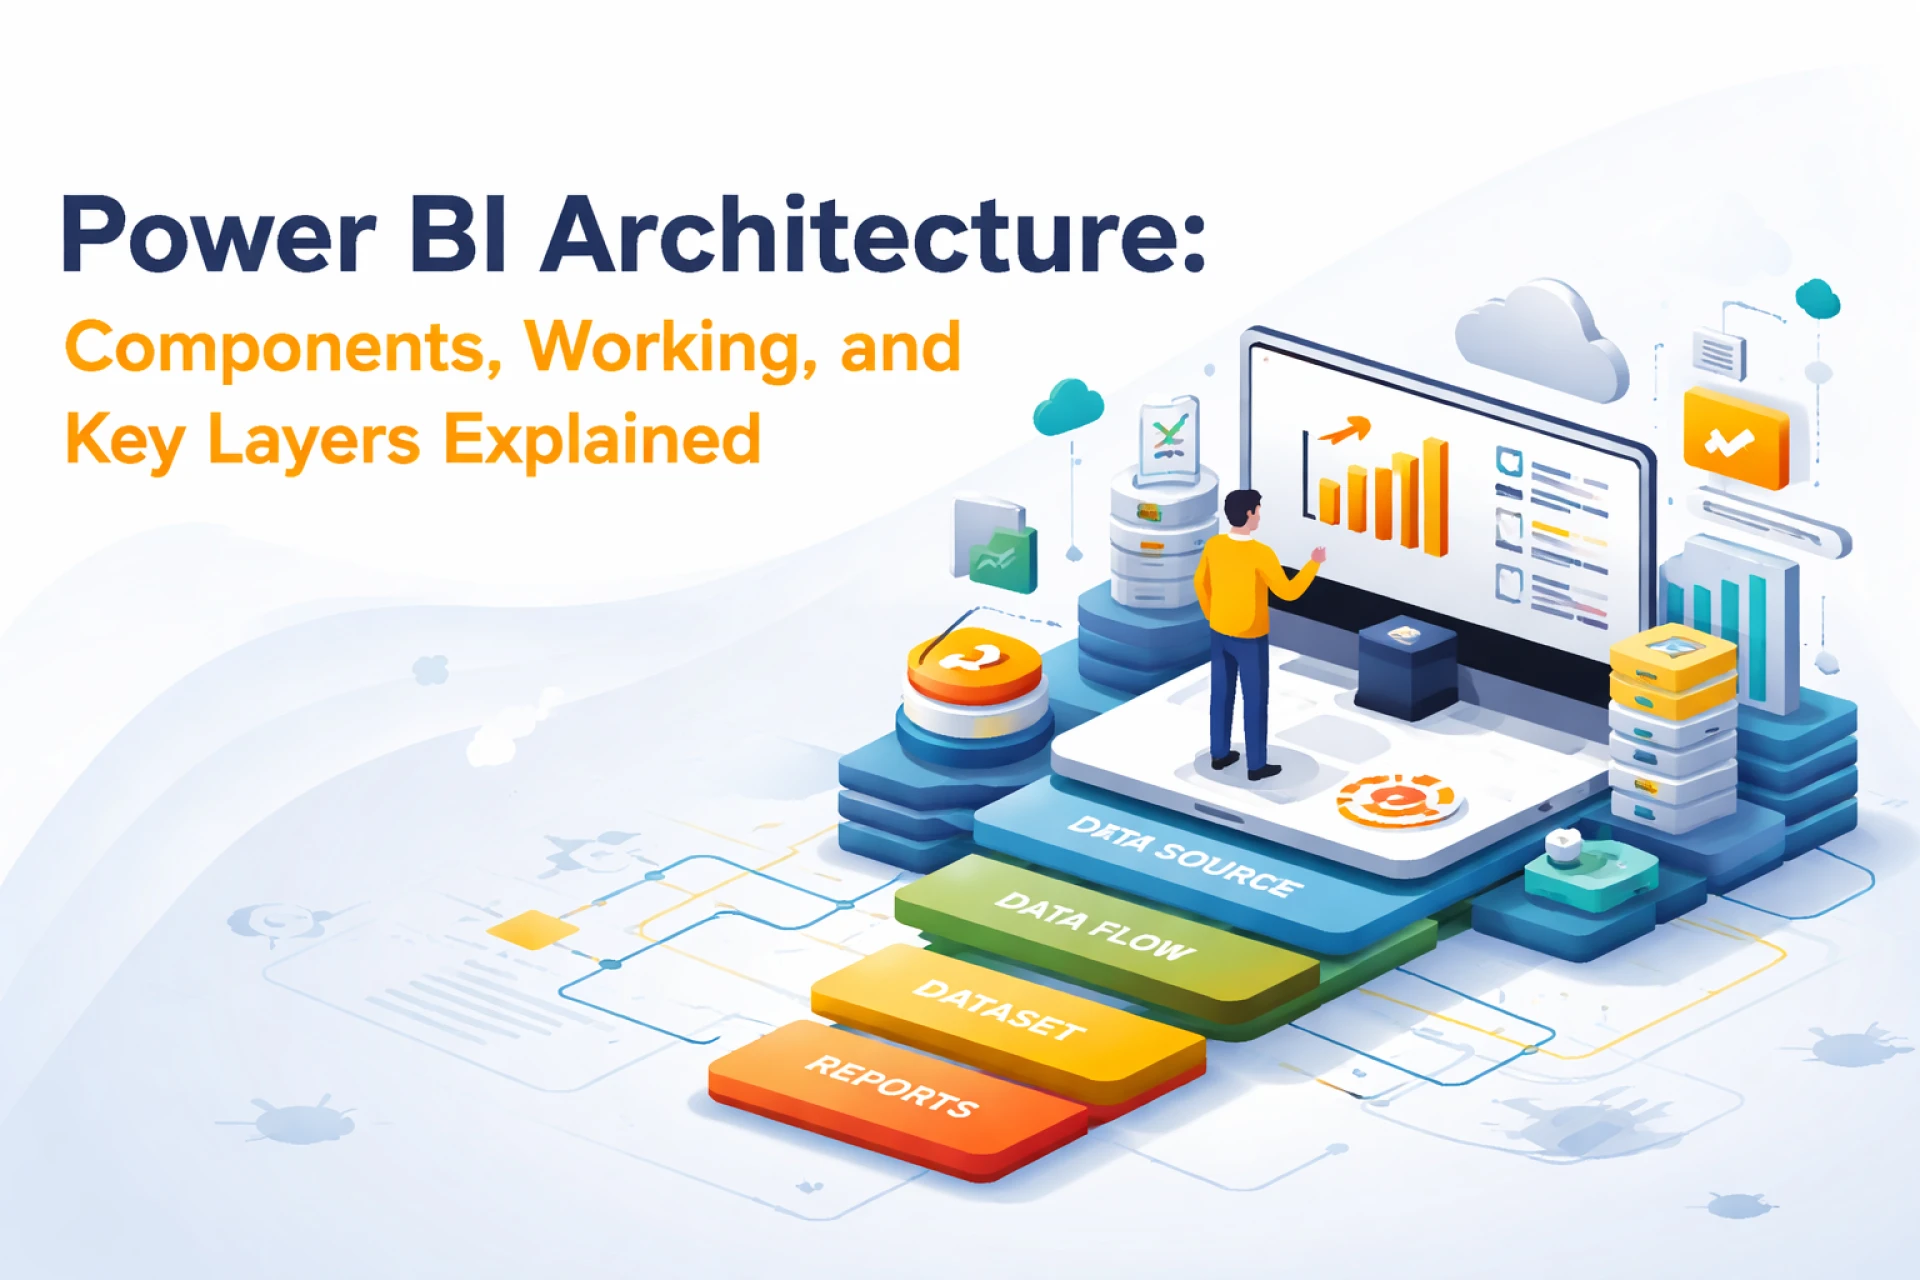
Power BI architecture is the collection of different components and services working together to process data and build interactive dashboards and reports. In short, it can be considered a pipeline where data flows from different sources after transformation and modeling stages, and then they are shared further to users in the form of data visualization or reports.
The Power BI architecture has been designed to support both cloud-based and on-premises environments. This makes it a very flexible tool for modern enterprises.
Key Components of Power BI Architecture
The Power BI Architecture consists of several interconnected components. Each of the components has a specific role in the data lifecycle. Here are some of the essential components of this tool:
- Data sources
They are the starting points of architecture. Power BI is connected to a lot of data sources, including:
- Excel files, CSV, JSON
- Databases and data warehouse systems
- APIs and cloud platforms
Depending upon the requirement, users have the option to either import data or establish a live connection for data streaming.
- Power Query or Data Transformation Layer
Power Query helps users extract, clean, and transform data. Data professionals can use it to:
- Remove inconsistencies in data
- Merge datasets
- Change data structures
This process is popularly known as data wrangling, and it is important to prepare data for analysis.
- Data Modeling (Power Pivot)
After data is processed/transformed, it is moved to the semantic layer or modeling layer. Here, users define the relationships between tables. Key features of this component include:
- Building columns and measures
- Using DAX, i.e., Data Analysis Expressions
- Building a semantic model
The data modeling layer is important for efficient data querying and analysis.
- Power BI Desktop
Analysts use this Power BI Desktop for development. It includes:
- Data connection (Power Query)
- Data modeling (Power Pivot)
- Data visualization tools
Professionals can use it to create reports and dashboards before publishing them.
- Power BI Service (Cloud Layer)
Reports are published and shared on this cloud-based platform called Power BI Service. It offers the following features:
- Collaboration and file sharing
- Data refresh periodically
- Managing datasets and dashboards centrally
Because of this, users get access to insights across organizations.
- Power BI Gateway
This is the bridge between on-premises data sources and cloud services. It is needed for:
- Secure data transfer
- Real-time or scheduled updates
Power BI Gateway is needed for hybrid architectures where data is mostly stored locally.
- Power BI Mobile Apps
This is the mobile application that helps users access dashboards and reports on their smartphones and tablets. This makes making decisions on the go easier.
- Power BI Report Server
Those organizations that require on-premises reporting use Power BI Report Server, which helps them host reports internally without relying on the cloud.
The following are the architectural layers in Power BI
- Data Layer – Source and ingestion
- Transformation Layer – Power Query
- Semantic Layer – Data modeling and DAX
- Visualization Layer – Reports and dashboards
- Access Layer – Service, mobile, and APIs
How does Power BI Architecture Work?
To understand the working of Power BI Architecture, you need to understand this step-by-step data pipeline:
- Data Ingestion – In this stage, data is collected from various sources such as data warehouse systems, APIs, cloud services, etc.
- Data Transformation – Then, the data collected is cleaned and transformed using Power Query to ensure they are consistent and usable.
- Data Modeling – Here, users define relationships, measures, and business logic using DAX
- Data Visualization – This stage involves creating reports and dashboards with Power BI Desktop
- Publishing and Sharing – Power BI Service is used to publish reports for collaboration and enterprise-wide access.
- Consumption – Finally, end users can view insights through web browsers and mobile apps
This is a simple workflow that ensures data is processed efficiently to get actionable insights.
To sum up!
Power BI architecture is a powerful framework that helps users streamline the entire journey of data from ingestion to visualization to sharing. It combines powerful tools like Power Query, Power BI Desktop, Power BI Service, etc., to help data professionals build efficient and scalable analytics solutions. By understanding this architecture, data science professionals can deliver high-quality data-driven insights to boost their organizations' business processes.


Sign in to leave a comment.