Candlestick patterns are one of the most powerful tools in technical analysis, helping traders understand market sentiment and predict potential price movements. Whether you're just starting out or looking to refine your trading strategy, learning candlestick patterns is essential—especially when trading on platforms like Delta Exchange.
In this beginner-friendly guide, we’ll break down what candlestick patterns are, how they work, and how you can use them effectively in crypto trading.
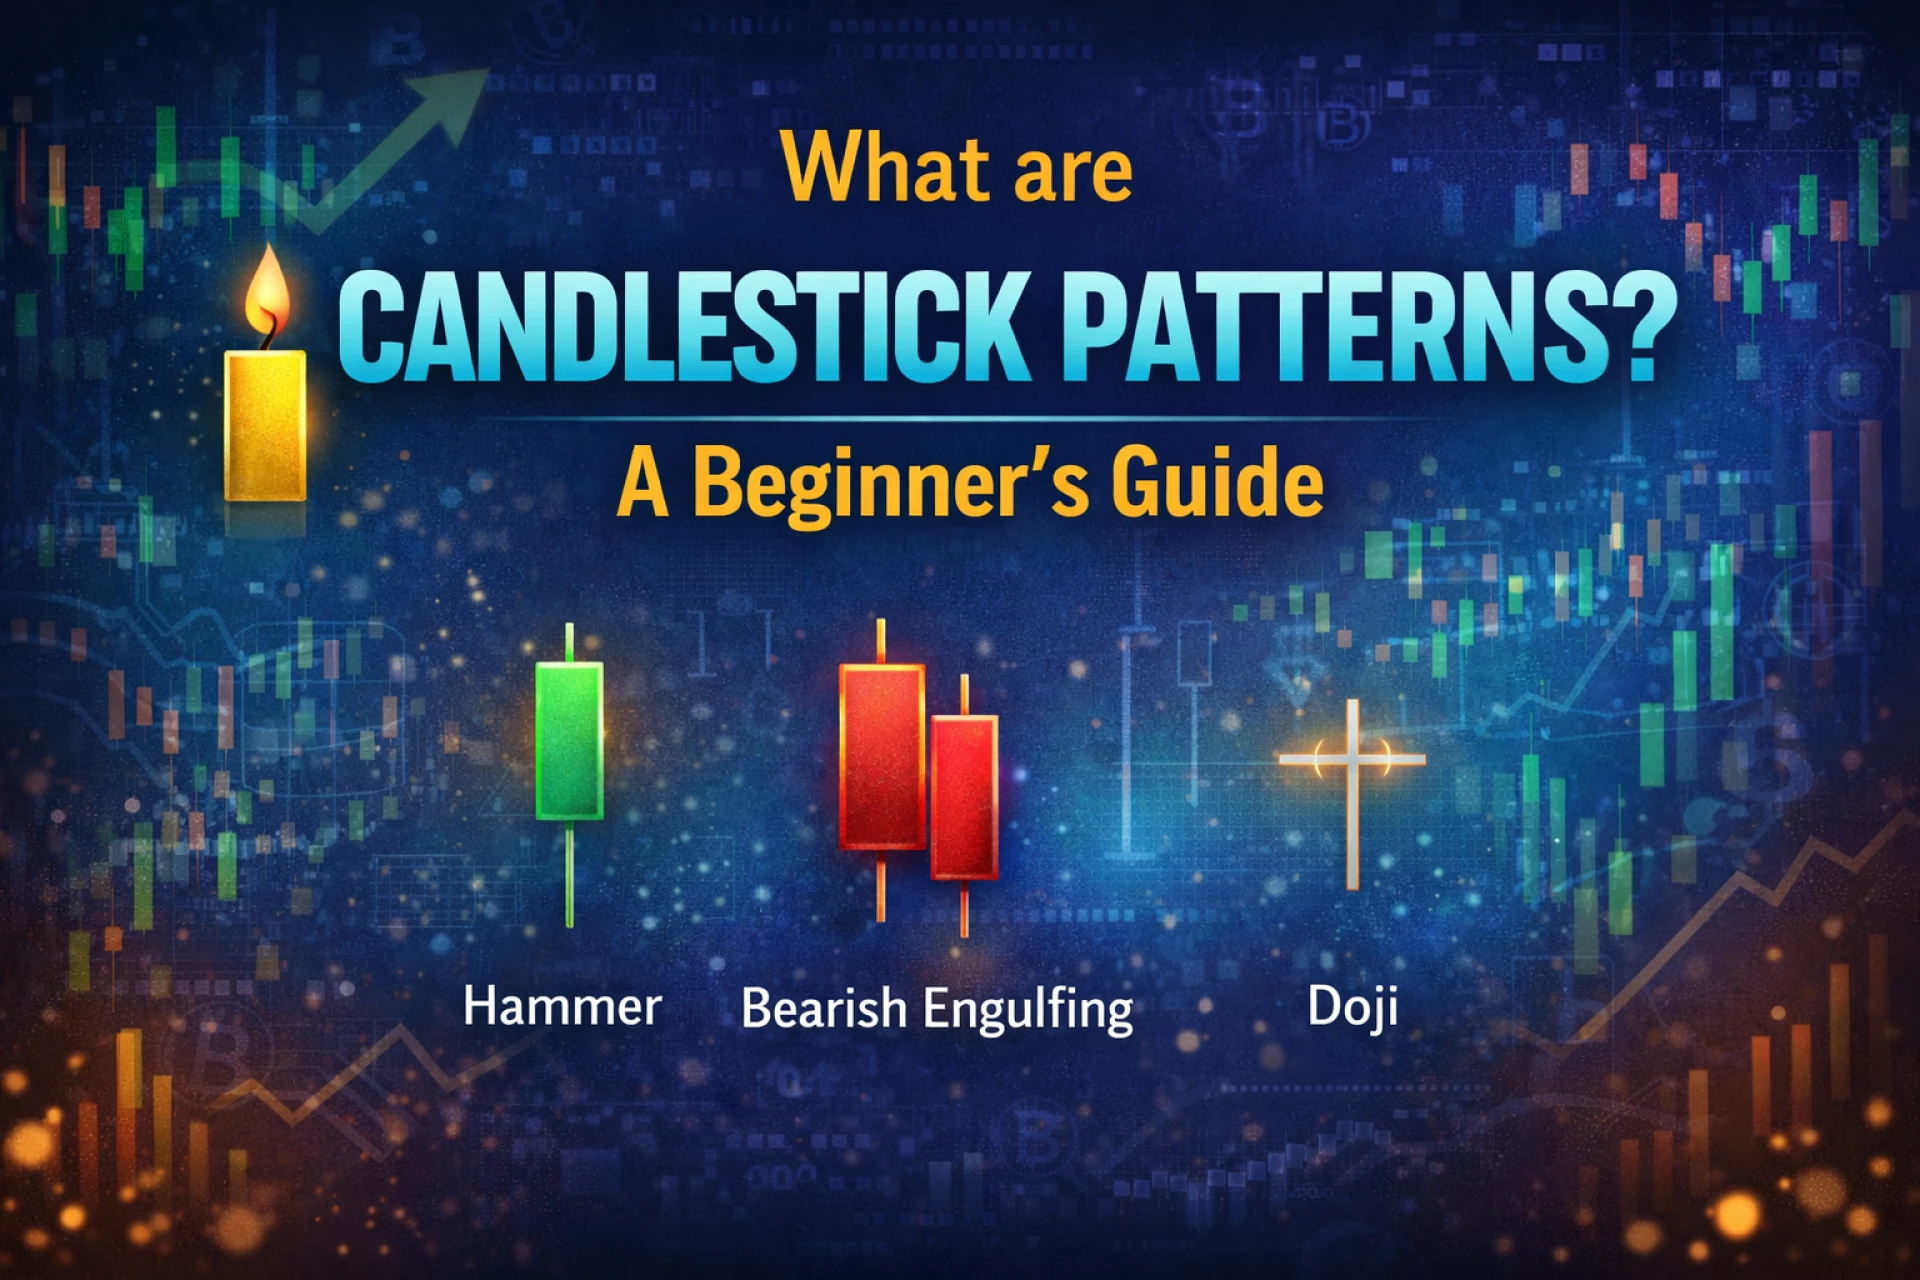
What Are Candlestick Patterns?
Candlestick patterns are visual representations of price movements within a specific time frame. Each “candlestick” shows four key data points:
- Open price
- Close price
- High price
- Low price
These patterns help traders analyze market psychology—whether buyers (bulls) or sellers (bears) are in control.
Anatomy of a Candlestick
Each candlestick consists of:
- Body: The range between open and close price
- Wick (Shadow): The highest and lowest price during the time period
Green/White Candle: Price closed higher than it opened (bullish)
Red/Black Candle: Price closed lower than it opened (bearish)
Types of Candlestick Patterns
Candlestick patterns are broadly divided into three categories:
1. Bullish Patterns (Signal Uptrend)
These patterns indicate potential price increases:
Hammer
- Small body, long lower wick
- Appears at the bottom of a downtrend
- Signals potential reversal
Bullish Engulfing
- A large green candle engulfs the previous red candle
- Strong buying pressure
Morning Star
- Three-candle pattern
- Indicates trend reversal from bearish to bullish
2. Bearish Patterns (Signal Downtrend)
These patterns suggest potential price drops:
Shooting Star
- Small body, long upper wick
- Appears at the top of an uptrend
Bearish Engulfing
- Large red candle engulfs previous green candle
- Strong selling pressure
Evening Star
- Three-candle pattern indicating bearish reversal
3. Neutral Patterns (Indecision)
These patterns show market uncertainty:
Doji
- Open and close prices are nearly equal
- Signals indecision
Spinning Top
- Small body with long wicks on both sides
- Indicates potential trend reversal
How to Use Candlestick Patterns in Crypto Trading
1. Combine with Support and Resistance
Candlestick patterns are more reliable near key levels.
2. Use with Indicators
Combine patterns with indicators like RSI, MACD, or Moving Averages for confirmation.
3. Consider Volume
Higher volume strengthens the validity of a pattern.
4. Choose the Right Timeframe
Patterns on higher timeframes (4H, 1D) are generally more reliable than lower ones.
Common Mistakes to Avoid
- Trading based on a single candlestick pattern
- Ignoring market trends
- Not using stop-loss
- Overtrading in volatile markets
Why Candlestick Patterns Matter for Traders
Understanding candlestick patterns helps traders:
- Identify entry and exit points
- Predict market reversals
- Improve risk management
- Enhance overall trading strategies
On Delta Exchange, traders can use advanced charting tools to spot candlestick patterns in real time and execute trades efficiently.
Final Thoughts
Candlestick patterns are a must-know for anyone entering the world of crypto trading. While they are powerful, they should always be used in combination with other technical tools and proper risk management.
By mastering candlestick patterns and applying them on platforms like Delta Exchange, beginners can build a strong foundation and trade with greater confidence.


Sign in to leave a comment.