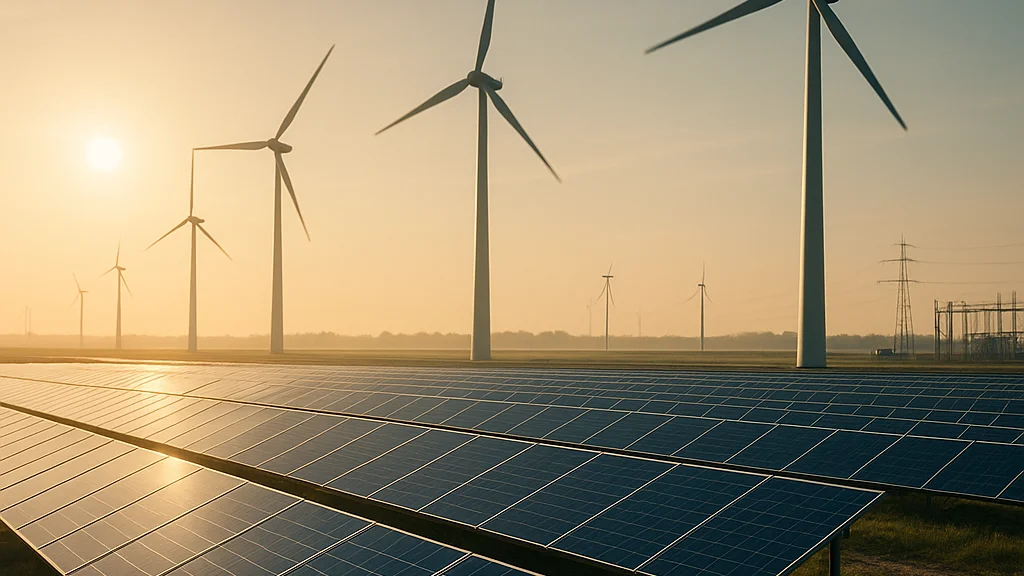

Stand on a ridge above a wind farm at dusk, or walk past a warehouse roof covered in solar panels, and the scale still feels oddly intimate. A turbine turns. A panel catches late light. Yet add those small motions together across continents and the result is historic: wind and solar are no longer side stories in power markets. They are becoming the main engine of new electricity capacity worldwide. According to Ember reporting cited by pv magazine International, solar and wind accounted for the vast majority of net power capacity additions in 2025, with solar alone dominating new buildouts. That shift matters not just for climate targets, but for grids, heavy industry, electric vehicles, and household bills.
I keep thinking about how quickly the conversation changed. A decade ago, the argument was often whether these technologies could scale. Now the harder question is different: can grids, permitting systems, storage markets, and supply chains keep up with their scale? And another question follows close behind: when people say wind and solar are growing fast, what exactly do they mean by capacity, and how does that differ from actual electricity generated?
Capacity growth is the clean-energy metric that appears simple until you look closer. It refers to how much generating equipment has been installed, usually measured in megawatts or gigawatts. More capacity does not automatically mean identical output across technologies, because solar and wind depend on weather, geography, and grid conditions. Still, capacity is where investment decisions, industrial strategy, and policy ambition become visible. If you want a quick companion piece after this one, WriteUpCafe has a useful overview at Beginner’s Guide to Wind and Solar Energy Capacity Growth. For a broader snapshot of the current acceleration, their Global Surge in Wind and Solar Energy Capacity Fuels Clean Power Transition article adds helpful context.
Wind and solar growth is no longer a niche environmental story. It is an infrastructure story, a manufacturing story, and actually a geopolitical story too.
This guide maps the big picture: how the world got here, where the fastest growth is happening, what the numbers really show, why 2025 and 2026 look like inflection years, and what investors, policymakers, EV watchers, and ordinary consumers should watch next.
How the world reached this buildout phase
The rise of wind and solar capacity did not happen because one technology suddenly became fashionable. It came from several forces stacking on top of each other over twenty years: falling equipment costs, better project finance, stronger policy mandates, manufacturing scale in China, utility demand for low-marginal-cost generation, and grid operators learning how to absorb variable power. Solar photovoltaics saw the most dramatic cost collapse. Module prices fell over the 2010s as Chinese manufacturing expanded, while inverters, trackers, and installation practices improved. Wind took a different path, advancing through taller towers, longer blades, better siting, and larger offshore machines.
Policy mattered at every stage. Germany’s feed-in tariffs helped launch early solar markets. The United States used tax credits to support both solar and wind deployment. China combined industrial policy with domestic installation targets, creating the world’s largest market for both technologies. India built large-scale solar parks. Brazil expanded wind in strong resource regions. Europe, after the energy shock triggered by Russia’s invasion of Ukraine, treated renewables not just as climate tools but as energy-security assets.
Then came the demand side. Power demand is rising again in many regions after years of slower growth, partly because of data centers, electrified transport, industrial reshoring, and air-conditioning loads during hotter summers. That matters for EVs directly. Every electric vehicle sold shifts more energy demand from oil markets to power systems. If the added electricity comes increasingly from wind and solar, transport decarbonization becomes more meaningful. If it comes from coal, less so. Capacity growth in clean power and growth in EV adoption are therefore connected, maybe more tightly than many headlines admit.
Another turning point was financial. Developers, banks, and utilities learned that solar and onshore wind could be repeatable asset classes. Auctions reduced prices. Corporate power purchase agreements created new demand. Storage started to pair with solar, making output more dispatchable during evening peaks. None of this removed obstacles, but it changed the default assumption from “experimental” to “bankable.”
- 2000s: early policy-led markets in Europe and the U.S.
- 2010s: steep cost declines and manufacturing scale, especially in solar
- Early 2020s: energy security concerns and higher fossil fuel volatility accelerate renewable deployment
- Mid-2020s: grids increasingly plan around renewables as the dominant source of new capacity additions
The result is what we see now: wind and solar are no longer proving they can grow. They are proving how fast whole systems can adapt around them.
What capacity growth really measures, and why the numbers can mislead
Capacity growth sounds straightforward: count how many gigawatts were added. But there are at least three layers to understand before comparing countries or technologies. First, installed capacity is not the same as electricity generated. A gigawatt of solar in a sunny desert may produce much more electricity over a year than a gigawatt in a cloudy northern climate. A gigawatt of offshore wind often delivers a higher capacity factor than onshore wind, but costs more to build and connect. Second, gross additions differ from net additions. If a country adds large amounts of solar while retiring coal, total capacity may rise modestly even as the generation mix changes dramatically. Third, connection delays can make announced projects look more real than they are.
This is why some public debates become confused. Critics point to wind and solar’s share of total energy, which includes transport fuels and industrial heat, and say their role is still small. Supporters point to their share of new power additions, which is much larger. Both can be true at once. Politifact recently emphasized that wind and solar remain a relatively small share of global total energy, while still being a rapidly growing source of electricity for homes and businesses. That distinction is essential.
Here is the cleaner way to read the data:
- Installed capacity tells you how much equipment exists.
- Generation share tells you how much electricity that equipment actually produced.
- Total energy share tells you how far electrification has spread beyond the power sector.
- Curtailed output reveals whether grids can use all available renewable generation.
- Storage and transmission additions show whether capacity growth can translate into reliable system performance.
According to the International Energy Agency and Ember data cited widely in 2025 and 2026 coverage, solar has become the single largest source of annual new power capacity worldwide. Wind remains crucial, though its growth profile is bumpier because permitting, offshore project costs, and supply-chain pressures can cause pauses. Solar is modular and fast to install; wind is site-sensitive and often more infrastructure-heavy. So when solar races ahead in annual additions, that does not mean wind is failing. It means the two technologies are operating on different industrial rhythms.
A power system can add renewables quickly on paper and still struggle in practice if transmission, storage, and market rules do not expand alongside generation.
That is maybe the most important caution in this whole discussion. Capacity growth is real progress, but it is not the whole story.
The global leaders: China first, then a very mixed field
No serious guide can avoid the central fact: China is the gravitational center of global wind and solar capacity growth. It manufactures most of the world’s solar modules, dominates much of the battery supply chain, and continues to install enormous volumes of utility-scale solar and wind. Chinese additions in recent years have been so large that they can reshape global totals on their own. Reports from Reuters, Ember, and industry analysts through 2025 repeatedly showed China accounting for an outsized share of new renewable capacity. This is not merely a domestic energy story. It affects equipment pricing, export competition, grid technology, and the speed at which the rest of the world can build.
After China, the picture fragments. The United States remains a major market, supported by tax incentives and manufacturing credits under the Inflation Reduction Act framework, though project timelines still run into interconnection queues, local opposition, and trade-policy uncertainty. India is expanding rapidly in solar, with ambitious targets and strong demand growth, but grid integration and land-use complexity remain real constraints. The European Union has accelerated renewable deployment since the gas crisis, yet member states differ sharply. Spain and the Netherlands have moved quickly in solar. Germany continues to build both wind and solar, but permitting and transmission bottlenecks still shape outcomes. Brazil has emerged as a standout in wind and solar growth, helped by strong resources and competitive project economics.
Canada offers a useful contrast. A CBC report on Ember’s findings argued that the future of electricity is increasingly wind and solar, while noting Canada’s slower uptake relative to some peers despite its clean-power advantages from hydro. That raises a quietly important point: countries with already low-carbon electricity do not always expand wind and solar as fast, because the decarbonization pressure is different. But slower growth can still become a competitiveness issue if industrial electrification accelerates.
For readers who want a country-by-country shortlist, WriteUpCafe’s Top 5 Wind and Solar Energy Capacity Growth Leaders is a practical supplement. The broader pattern looks like this:
- China: unmatched scale in manufacturing and installation
- United States: strong pipeline, uneven execution, major storage growth
- India: fast solar expansion tied to rising electricity demand
- European Union: policy-driven acceleration with grid and permitting variation
- Brazil: increasingly important emerging-market success case
What fascinates me is how different the pathways are. Some countries build because they want cleaner power. Others because they want cheaper new generation. Others because they want energy independence. Same turbines, same panels, very different political stories.
Why 2025 and 2026 feel like an inflection point
Several recent reports suggest the mid-2020s may be remembered as the moment wind and solar stopped looking like supplements and started looking like the default for new power growth. Ember findings covered by Yahoo News UK and mirrored by MSN highlighted a symbolic threshold: wind and solar overtook gas worldwide in electricity generation terms in the context discussed by that report. Meanwhile, pv magazine International reported that solar and wind effectively took over global power growth in 2025, with solar responsible for the largest share of net new additions.
Those headlines do not mean fossil fuels vanished. Coal remains deeply embedded in many systems, especially where demand growth is very high or legacy assets are young. Gas still plays a balancing role in many markets and remains central in others. But the direction of travel is harder to deny now. If most new capacity is renewable, the long-run economics of the power sector start changing even before old fossil assets retire.
In 2026, three developments stand out. First, utility-scale solar continues to expand at speed because it is relatively fast to procure and install. Second, battery storage is growing from “helpful add-on” to “core grid asset,” especially in the United States, China, and Australia. Third, offshore wind is in a more uneven phase. Some projects are moving ahead, but cost inflation, financing stress, and supply-chain constraints have forced renegotiations or delays in several markets. Onshore wind, by contrast, often struggles more with permitting and local acceptance than with pure technology cost.
Another recent shift is industrial policy. Governments are no longer only subsidizing deployment; they are trying to localize manufacturing of modules, cells, inverters, blades, towers, and batteries. That introduces trade friction. Tariffs, anti-dumping cases, local-content rules, and subsidy races can all slow deployment in the short term while aiming to strengthen domestic supply chains in the long term. Is that contradiction manageable? Maybe. But it means capacity growth is now entangled with industrial competition in a way that feels much sharper than five years ago.
If you want a narrower 2026-focused companion read, WriteUpCafe’s Wind and Solar Energy Capacity Growth Worldwide in 2026 tracks this year’s momentum in a more snapshot style.
The friction points: grids, storage, land, and money
When people ask what could slow worldwide wind and solar capacity growth, the answer is rarely “lack of technology.” The harder barriers are systems barriers. Transmission is first. New wind and solar projects are often built where land and resources are best, not where demand is highest. That means long-distance grid expansion. In many countries, transmission permitting is slower than generation permitting, which creates a strange outcome: projects are built faster than the wires needed to use them fully.
Storage is second. Solar-heavy systems need ways to shift daytime generation into evening demand peaks. Wind-heavy systems need flexibility for calm periods. Batteries are scaling fast and costs have improved over time, but multi-day and seasonal balancing remain more difficult. Pumped hydro, demand response, interregional transmission, and flexible industrial loads all matter here. So does market design. If grids do not compensate flexibility properly, investment stalls.
Third comes land and public acceptance. Solar can compete with agriculture or conservation goals unless projects are carefully sited. Onshore wind can trigger local opposition over views, noise concerns, or wildlife impacts. Offshore wind avoids some land-use battles but creates others around fisheries, ports, and marine ecosystems. None of these issues are trivial, and treating them as trivial usually backfires.
Finally, money. Renewable projects are capital-intensive upfront. Higher interest rates hurt them more than fossil plants with lower initial capital costs and higher fuel costs over time. That was a major issue for offshore wind in particular in 2023 through 2025. Financing conditions improved in some markets, but cost of capital remains a decisive variable, especially in emerging economies where electricity demand growth is strongest.
The next bottleneck is not whether the world can manufacture enough panels and turbines. It is whether institutions can approve, finance, connect, and balance them fast enough.
That is why capacity growth should always be read together with interconnection queues, transmission approvals, battery additions, and wholesale market reform. One number alone never tells the whole truth.
What this means for electric vehicles, industry, and power prices
Because this article sits in the clean energy and EV space, it is worth making the connection directly. Wind and solar capacity growth changes the economics of transport electrification. The more low-cost renewable electricity enters the grid, the stronger the case for EV charging at scale, especially when paired with smart charging that shifts demand into hours of abundant solar or nighttime wind. Fleets, logistics depots, and public charging operators increasingly think in these terms. They are not just buying electricity; they are buying timing flexibility.
For industry, the story is similar but more complex. Steel, chemicals, data centers, and hydrogen projects all want large volumes of power at predictable prices. Wind and solar can provide low marginal-cost electricity, but only if paired with contracts, storage, transmission access, or flexible operations. That is why corporate power purchase agreements have grown. Manufacturers want to lock in pricing and emissions performance. In some regions, access to clean electricity is becoming a site-selection factor for factories.
Power prices themselves can move in opposite directions depending on the timeframe. In the wholesale market, abundant solar often pushes midday prices down sharply, sometimes even below zero. Consumers do not always feel those savings immediately because retail tariffs include network costs, taxes, and legacy charges. But over time, systems with high renewable penetration can reduce fuel-price exposure. Europe’s gas crisis made this point brutally clear. Countries with more wind, solar, hydro, and nuclear were generally less exposed to imported gas price shocks than those leaning more heavily on gas-fired generation.
There is a social angle too. Rooftop solar, community wind, and local storage can distribute benefits more widely, but utility-scale buildouts can also concentrate gains if policy is poorly designed. Who owns the assets? Who gets cheaper bills? Who bears the land-use impacts? Those are political questions, not just engineering ones.
Readers looking for practical policy and deployment ideas can pair this with WriteUpCafe’s Expert Tips to Accelerate Wind and Solar Capacity Growth, which focuses more directly on implementation choices.
What to watch next in worldwide capacity growth
So where should careful readers keep their eyes over the next few years? First, watch whether solar keeps extending its lead in annual additions. The odds still favor yes, because solar is modular, globally tradable, and quicker to deploy than most alternatives. Second, watch whether wind rebounds more strongly after the recent uneven period. Onshore wind still has excellent economics in many markets, and offshore wind remains strategically important for densely populated coastal economies even if near-term costs stay elevated.
Third, watch storage numbers alongside generation numbers. A country adding 20 gigawatts of solar tells you something. A country adding 20 gigawatts of solar plus large battery fleets, transmission corridors, and flexible demand programs tells you much more. Fourth, pay attention to curtailment. Rising curtailment is not always failure; sometimes it is a temporary sign that cheap renewables are arriving faster than grids can adapt. But if it persists, it can undermine project economics and slow new investment.
Fifth, keep an eye on trade politics. Global capacity growth depends heavily on supply chains that cross borders. If major economies intensify tariff disputes or local-content requirements without building domestic manufacturing fast enough, project costs can rise. Finally, watch electrification demand. More EVs, more heat pumps, more data centers, and more electric industry can actually make renewable buildouts easier to absorb by increasing electricity demand at the same time.
My own quiet conclusion? The central debate has shifted from “Can wind and solar scale worldwide?” to “Can governance scale worldwide?” Panels and turbines are visible. Institutions are not. Yet institutions may decide whether this remarkable capacity growth turns into a stable, affordable clean-power system.
And maybe that is the real guide here. Follow the gigawatts, yes. But also follow the wires, the batteries, the permits, the auctions, the factories, and the politics. Ask simple questions that are actually not simple at all: where is the power generated? When is it needed? Who can move it? Who can store it? Who benefits?
If those questions are answered well, wind and solar capacity growth will look less like a temporary surge and more like the durable backbone of the global electricity system. Right now, that outcome feels not guaranteed, but very plausible. For clean energy, and for electric transport built on clean grids, that is a profound change.























Sign in to leave a comment.