Every page on a website has a function, whether it is to increase clicks, qualify visitors, offer a solution, or even a combination of all of those things.
You can determine if your page is accomplishing that goal or working against it using heatmaps and logged user sessions.
The secret of heatmap tools
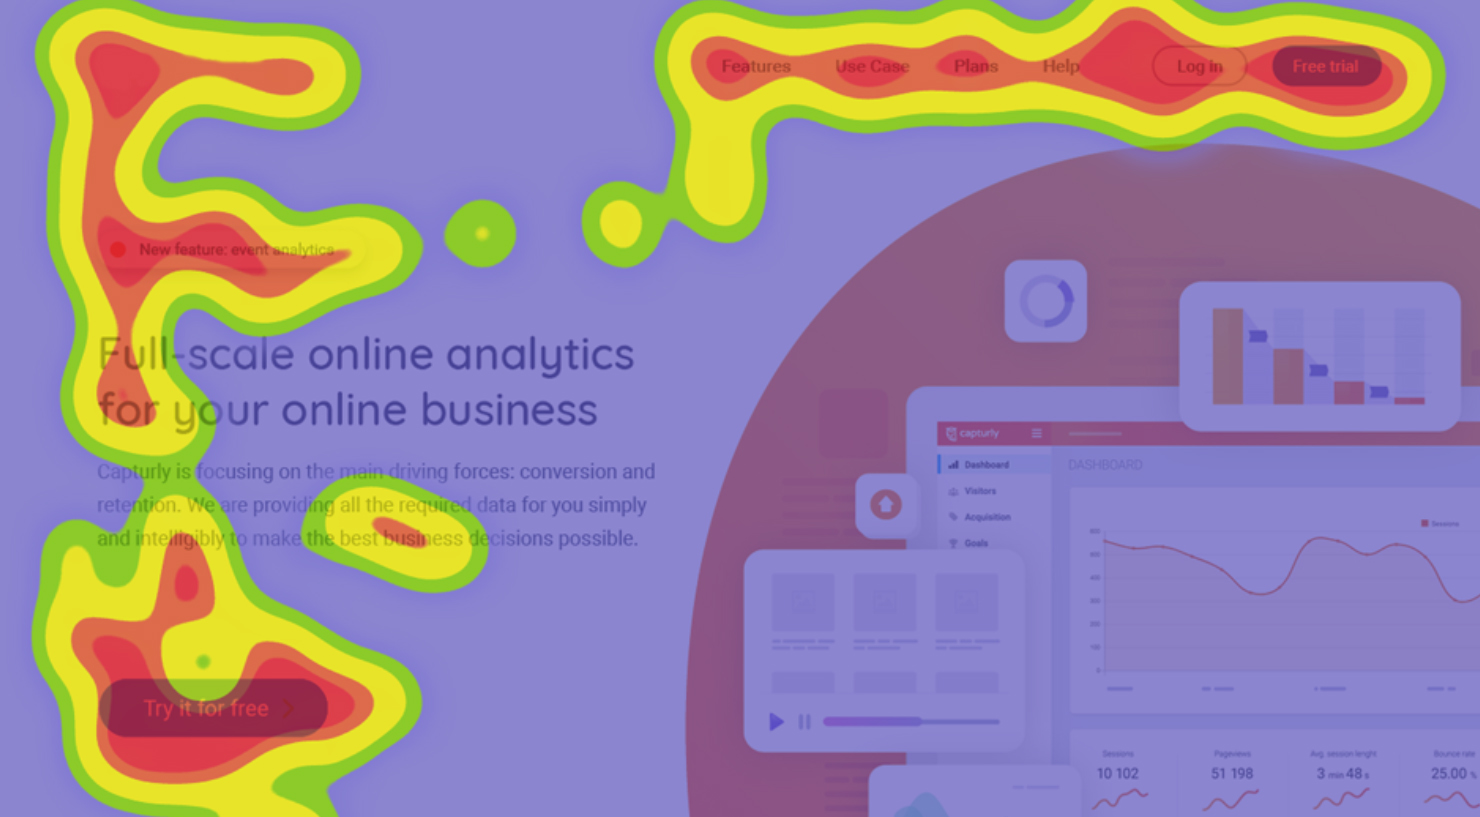
In general, heatmaps are graphical data representations that use color to emphasize value. On a website heatmap, the most popular areas are shown in red (hot), and the least popular areas are highlighted in blue (cold).
On a scale, the hues go from red to blue.
Heatmaps are a great way to gather information about user activity and use it to analyze in-depth how people interact with the pages of your website. It can analyze:
– Browse the rating
– What is clicked on and what is not clicked on
– Who reads what
You may detect user patterns and determine what needs to be optimized to increase interaction with the aid of that information.
In order to improve your website design process and comprehend your visitors, setting up website heat mapping software is a terrific place to start.

www.capturly.com
Situations you must use heatmaps
You are not alone if you think that heatmaps are simply another gimmicky feature that industry thought leaders are attempting to sell you. They may appear to be a surplus or a niche.
In actuality, heatmaps may be quite helpful for analyzing and improving user experiences and conversion chances. There are several occasions when you ought to employ them.
Making changes to your website
Your website has to be improved or updated; it cannot just be put on your list of things to do. If you want the redesign to be worthwhile investing time and money in, you need to give it careful consideration, attention, and originality.
Heatmaps may be used to analyze your present design and determine what elements your visitors are interacting with and ignoring. You'll gain insight into what motivates your visitors so you can create a website tailored to your target market.
Conversion analysis for websites
Are you trying to determine why some of your web pages aren't converting the way you anticipated? Employ a heatmap. You'll be able to determine precisely what is grabbing people's attention and determine why.
The same holds true for buttons and sites that are converting at a faster pace than expected.
You'll be able to optimize your underperforming web pages by paying close attention to the design, copy, and other factors that are working for you.
Examining fresh updates
Naturally, you'll want to test new ideas as your company expands and as you improve them. With heatmaps, you may go beyond A/B testing's ability to gauge and assess visitors' reactions to a project or design.
Determine precisely what interests your visitors by using the data graph. You might be able to transfer designs or parts from the page that didn't do as well into the one that did at the conclusion of the testing time.
What a heatmap will teach you
You may discover a lot about the usability of your website's interface and the general user experience by using the data you get from a heatmap.
Heatmaps let firms notice things like:
– Which pictures draw viewers' attention and how do they interact with them?
– Which blog/article titles pique readers' interest? Which CTAs and forms and if they're too far down the page are viewed and used?
– What diverts your audience away from your essential, core material
– The location where you may update or modify your navigation
– How much information is typically read before visitors leave?
What types of heatmaps you can find on the market?
There are three primary categories of heatmapping tools for marketers and companies.
Click maps and mouse movement maps
The most frequently visited links and buttons on a website may be identified using heatmaps of mouse movements, scrolling, and clicks on a certain site page. On the other hand, you may also determine which elements receive the fewest clicks.
User sessions captured
To discover behavioral trends, use video screen recordings of actual people engaging with your website.
Scroll heatmaps
These heatmaps show the proportion of visitors who browse through each page of your website. Focus on enhancing the material that appears above the fold (as soon as your internet page loads).

www.uxmatters.com
Analysis of a heatmap
If you know what you're looking for, reading heatmaps is not too difficult. There are two main approaches to one's analysis:
Visually
You may read your website for engagement levels and attention “hot spots” using color-coded visuals. The areas of the map where red is displayed are those with the highest levels of visitor interaction. Low numbers appear blue.
With a visual read, you may identify design flaws or possibilities to reposition buttons, forms, and the like.
Data sources
You may gain more detailed knowledge about the performance of your page by looking at raw data tables. To truly grasp what is attracting visitors, you may look at HTML components and the pixel positions of clicks.
Try these 5 heatmapping software options
You'll likely get a ton of alternatives when you search for “heatmapping software,” but quality almost never wins out over quantity. How can you tell which product will provide you with the best results?
We've done our homework and identified the best heatmapping programs currently on the market.
Hotjar
Hotjar is a simple-to-use, clear-to-read solution that may be used to better understand your consumers. Their heatmaps encompass everything from visitor records to conversion funnel analysis, with a focus on visual feedback and quick outcomes.
Hotjar raises the bar for heatmapping with its comprehensive software that enables you to examine every area of your website's interaction analytics.
Hotjar offers a free account with constrained reporting and 2,500 daily page views. The beginning package is $95/mo for larger firms seeking 20,000 page views each day.
Tableau
Users seeking immediately available, real-time reporting can utilize Tableau to find useful information. Navigating the product is simple thanks to drag-and-drop functionality and intelligent dashboards.
With their cloud storage, omnichannel data access is possible from any location. Ad hoc analysis can be done whenever it's convenient for you. To increase the business effect, you may also share your reports with anyone.
Users may test out Tableau's complete version for free, and the first tier costs $70 per person each month.
Freshmaker
Freshmarketer goes above and above to map out visitor interactions with integrated A/B testing and combined heatmaps. You may examine heatmaps based on the device, which the program recognizes automatically, and they are recorded in real-time.
Freshmarketer, which provides scroll maps and click maps, aims to “go beyond typical heatmaps.”
Price: Freshmarketer's email marketing, automation, and segmentation packages all come with their heat mapping software at no additional cost. Plans begin at $66 per month.
Looker
Looker provides features comparable to those of the other software choices mentioned, but they also offer a special security management tool to safeguard your data. Additionally working with Google Cloud, you'll have access to reports from any location.
You'll have access to various data intelligence and visualization options, but the main focus of the service is data analysis.
Price: Looker provides a free trial after which you may request an estimate depending on your company's requirements.
Zohopagesence
Deep data analytics are provided by Zoho PageSense using a CRO platform with an intuitive user interface. You may set targets and develop your funnel analysis on your dashboard, both of which are intended to simplify your conversion skills.
To go deeper into the specifics of what and why your visitors are interacting with your forms, you'll have access to form analytics, session recording, and A/B testing.
Price: If you pick a monthly subscription option, Zoho PageSense starts at $39/mo. for three projects.
Conclusion
When it comes to enhancing their business to attract and convert visitors, marketers, and developers have such a large, varied toolbox to choose from.
It might be difficult to determine which will enable your company to achieve its objectives. But now that you are aware of how heatmaps work for your website, you may want to use them.
For a consistent analysis, heatmaps are often performed continually in the background, however, this isn't a must. In fact, it can make it take longer for your website to load. Turn it on and off as necessary if doing so suits your requirements better.
But in the end, you need to begin utilizing this program right away.
0


