skillfinlearning's articles Understand how to Beat the Stock market with Stock Market Valuation Courses Is it realistic to expect that individual investors who don't have access to super-fast computers or a mathematical background of doctoral-level to consistently outperform the stock market? The consensus of sixty years' worth of research that has earned Nobel Prizes is that this cannot be done. But there's a chance that it is. In […] August 31, 2022August 31, 2022 Saving Bookmark this article Bookmarked How to Use a Pivot Table in Excel To quickly create an interactive summary from numerous items in a huge Excel dataset, a pivot table is a great tool. Additionally, it can count totals, compute averages, and make cross-tabulations. Another advantage of utilizing pivot tables in excel is that you can easily drag and drop the source table's columns to modify the format […] June 22, 2022June 22, 2022 Saving Bookmark this article Bookmarked Benefits of Excel Pivot Table Courses Have you ever looked at an excel sheet just filled with a huge amount of data and can't make any sense of it at all? And you don't know how to handle it or how exactly to deal with it? That's when you need an excel pivot table to manage your data. Pivot table is […] May 17, 2022May 17, 2022 Saving Bookmark this article Bookmarked Learn Financial Modeling Functions Online What is Financial Modeling? Financial Modeling is a tool that gives the financial representation of any company. It is an approach through which you can estimate the financial performance of a business or a project by considering all the pertinent factors, risk assumptions and growth and then analysing their impact on the said business or […] April 16, 2022April 16, 2022 Saving Bookmark this article Bookmarked Pivot Table in Excel – The Best Course Online Pivot tables are interactive tables that allow the user to group and summarize large amounts of knowledge during a concise, tabular format for easier reporting and analysis. March 22, 2022March 22, 2022 Saving Bookmark this article Bookmarked Financial Modeling Functions Online Defining Financial Modeling Functions A financial model is used to determine the value of a business or compare it to other similar companies. Many companies use financial models to determine their budget, allocation of resources and cost of new projects. There are many different kinds of models depending on the purpose you are designing them […] February 21, 2022February 21, 2022 Saving Bookmark this article Bookmarked Why Learn Stock Market Valuation Fundamentals A stock index is an indicator of the stock market that acts as a thermometer: it can make you see, at a single glance, the majority movement of the companies in said market. There are multiple indices around the world. They are essential to analyze how a series of listed assets with specific characteristics varies. […] January 18, 2022January 18, 2022 Saving Bookmark this article Bookmarked Why Learn Stock Market Valuation Fundamentals A stock index is an indicator of the stock market that acts as a thermometer: it can make you see, at a single glance, the majority movement of the companies in said market. January 18, 2022January 18, 2022 Saving Bookmark this article Bookmarked The Best Excel Training Platforms for Beginners to advance What is Excel? Microsoft Excel is one of the platforms that provides spreadsheet programs utilized for calculating the data, analysis, representation and significantly more. It tends to get to information or data from outer data sets and is an amazing tool for information displaying and financial computations. What you will get to learn in […] December 14, 2021December 14, 2021 Saving Bookmark this article Bookmarked What are Financial Modelling Function In Excel Are you a financial analyst? If yes, then Microsoft Excel will be your best friend. Excel is one of the analyst's most preferred financial modeling tools as it offers several functions that help analysts create a model and do analysis. These functions always make the task easier and help in completing the tasks at a […] November 12, 2021November 12, 2021 Saving Bookmark this article Bookmarked Importance of Pivot Tables in Excel It is possible to summaries a data set using a pivot table, which may store the summary in a condensed way. Rows, columns, data fields, and pages are all components of the table. These components may be moved about, allowing the user to expand, isolate, sum, and group the specific data in real-time, according to […] October 11, 2021October 11, 2021 Saving Bookmark this article Bookmarked Understand and Invest in Stock market with Stock Market Valuation Fundamentals Course All businesses require money to function correctly. Occasionally, the profit generated by goods and services is insufficient to cover operating capital costs. As a result, enterprises allow ordinary people like you and me to invest money in their companies to work more efficiently. In exchange, investors receive a part of any profits that the businesses […] September 14, 2021September 14, 2021 Saving Bookmark this article Bookmarked 8 Most Useful Excel Functions For Financial Modeling To manage and run effectively, today's business needs a variety of technology and equipment. For Financiers and Accounting Analysts, Microsoft Excel is the most helpful tool. Learning which Excel function to employ in each circumstance speeds up your work and allows you to create more strong and powerful programs. You've reached the correct place if […] August 24, 2021August 24, 2021 Saving Bookmark this article Bookmarked How do Pivot Tables in Excel Help s Professional? Pivot tables in excel are nothing, but communal excel tables that tactically organises, summarises and juxtaposes massive amounts of data and information from an excel worksheet. These tables make it easier for professionals to dice and slice the data and analyse it if it has any dissimilarities, similaritiesor other crucial patterns. Professionals utilise these tables to […] July 30, 2021July 30, 2021 Saving Bookmark this article Bookmarked
Understand how to Beat the Stock market with Stock Market Valuation Courses Is it realistic to expect that individual investors who don't have access to super-fast computers or a mathematical background of doctoral-level to consistently outperform the stock market? The consensus of sixty years' worth of research that has earned Nobel Prizes is that this cannot be done. But there's a chance that it is. In […] August 31, 2022August 31, 2022 Saving Bookmark this article Bookmarked
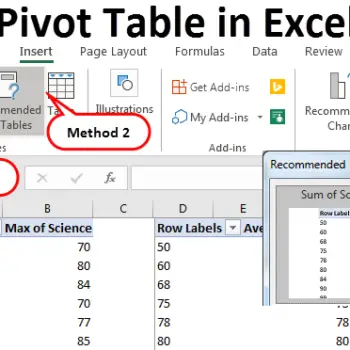
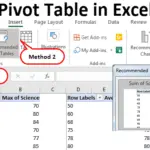
How to Use a Pivot Table in Excel To quickly create an interactive summary from numerous items in a huge Excel dataset, a pivot table is a great tool. Additionally, it can count totals, compute averages, and make cross-tabulations. Another advantage of utilizing pivot tables in excel is that you can easily drag and drop the source table's columns to modify the format […] June 22, 2022June 22, 2022 Saving Bookmark this article Bookmarked
Benefits of Excel Pivot Table Courses Have you ever looked at an excel sheet just filled with a huge amount of data and can't make any sense of it at all? And you don't know how to handle it or how exactly to deal with it? That's when you need an excel pivot table to manage your data. Pivot table is […] May 17, 2022May 17, 2022 Saving Bookmark this article Bookmarked
Learn Financial Modeling Functions Online What is Financial Modeling? Financial Modeling is a tool that gives the financial representation of any company. It is an approach through which you can estimate the financial performance of a business or a project by considering all the pertinent factors, risk assumptions and growth and then analysing their impact on the said business or […] April 16, 2022April 16, 2022 Saving Bookmark this article Bookmarked
Pivot Table in Excel – The Best Course Online Pivot tables are interactive tables that allow the user to group and summarize large amounts of knowledge during a concise, tabular format for easier reporting and analysis. March 22, 2022March 22, 2022 Saving Bookmark this article Bookmarked
Financial Modeling Functions Online Defining Financial Modeling Functions A financial model is used to determine the value of a business or compare it to other similar companies. Many companies use financial models to determine their budget, allocation of resources and cost of new projects. There are many different kinds of models depending on the purpose you are designing them […] February 21, 2022February 21, 2022 Saving Bookmark this article Bookmarked
Why Learn Stock Market Valuation Fundamentals A stock index is an indicator of the stock market that acts as a thermometer: it can make you see, at a single glance, the majority movement of the companies in said market. There are multiple indices around the world. They are essential to analyze how a series of listed assets with specific characteristics varies. […] January 18, 2022January 18, 2022 Saving Bookmark this article Bookmarked
Why Learn Stock Market Valuation Fundamentals A stock index is an indicator of the stock market that acts as a thermometer: it can make you see, at a single glance, the majority movement of the companies in said market. January 18, 2022January 18, 2022 Saving Bookmark this article Bookmarked
The Best Excel Training Platforms for Beginners to advance What is Excel? Microsoft Excel is one of the platforms that provides spreadsheet programs utilized for calculating the data, analysis, representation and significantly more. It tends to get to information or data from outer data sets and is an amazing tool for information displaying and financial computations. What you will get to learn in […] December 14, 2021December 14, 2021 Saving Bookmark this article Bookmarked
What are Financial Modelling Function In Excel Are you a financial analyst? If yes, then Microsoft Excel will be your best friend. Excel is one of the analyst's most preferred financial modeling tools as it offers several functions that help analysts create a model and do analysis. These functions always make the task easier and help in completing the tasks at a […] November 12, 2021November 12, 2021 Saving Bookmark this article Bookmarked
Importance of Pivot Tables in Excel It is possible to summaries a data set using a pivot table, which may store the summary in a condensed way. Rows, columns, data fields, and pages are all components of the table. These components may be moved about, allowing the user to expand, isolate, sum, and group the specific data in real-time, according to […] October 11, 2021October 11, 2021 Saving Bookmark this article Bookmarked
Understand and Invest in Stock market with Stock Market Valuation Fundamentals Course All businesses require money to function correctly. Occasionally, the profit generated by goods and services is insufficient to cover operating capital costs. As a result, enterprises allow ordinary people like you and me to invest money in their companies to work more efficiently. In exchange, investors receive a part of any profits that the businesses […] September 14, 2021September 14, 2021 Saving Bookmark this article Bookmarked
8 Most Useful Excel Functions For Financial Modeling To manage and run effectively, today's business needs a variety of technology and equipment. For Financiers and Accounting Analysts, Microsoft Excel is the most helpful tool. Learning which Excel function to employ in each circumstance speeds up your work and allows you to create more strong and powerful programs. You've reached the correct place if […] August 24, 2021August 24, 2021 Saving Bookmark this article Bookmarked
How do Pivot Tables in Excel Help s Professional? Pivot tables in excel are nothing, but communal excel tables that tactically organises, summarises and juxtaposes massive amounts of data and information from an excel worksheet. These tables make it easier for professionals to dice and slice the data and analyse it if it has any dissimilarities, similaritiesor other crucial patterns. Professionals utilise these tables to […] July 30, 2021July 30, 2021 Saving Bookmark this article Bookmarked