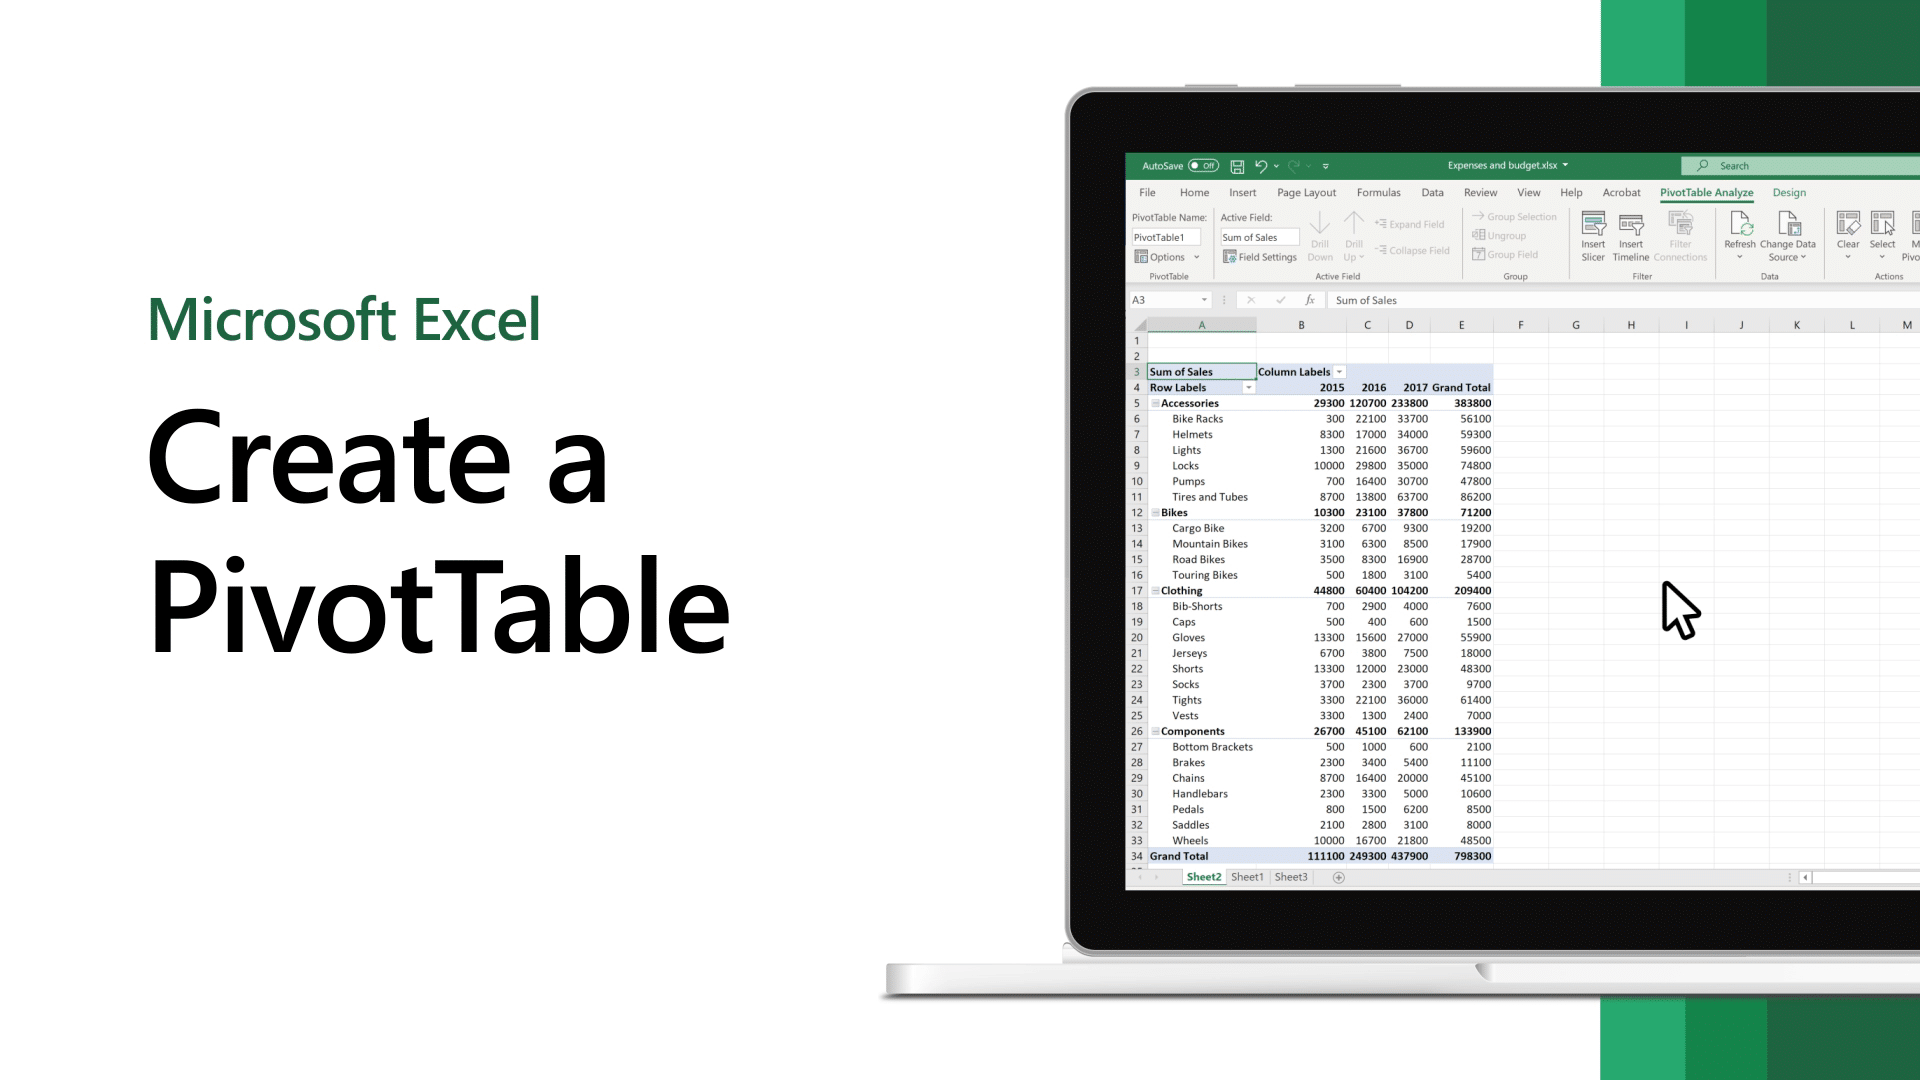
It is possible to summaries a data set using a pivot table, which may store the summary in a condensed way. Rows, columns, data fields, and pages are all components of the table. These components may be moved about, allowing the user to expand, isolate, sum, and group the specific data in real-time, according to their needs. This table enables the user to see the differences between a large number of pieces of information.
With the use of a Pivot table in excel, a user-supplied data field is transformed into an informed choice that can be easily modified by the client in the table's header. Columns holding data may be readily deleted from, added to, or changed about in a table with relative simplicity.
Long spreadsheets of raw data may be transformed into user-friendly and practical summaries with this software. The information may be summarised in a variety of ways, including frequencies and averages. There are many advantages to using a pivot table in Excel, which is detailed here.
Simple to Operate
One of the most significant advantages of pivot tables is that they are simple to use. By moving the columns to various parts of the table, you may quickly summarize the table’s information. With a single mouse click, you may rearrange the columns in any way you see fit.
Data Analysis Made Simple
With the assistance of pivot tables in Excel, you may manage vast amounts of data in a single operation without difficulty. These tables let you take a considerable quantity of data and work with it in such a manner that you only need to see a few data columns at a time, saving you time. This facilitates the examination of vast amounts of data straightforwardly.
A concise summary of the data
Another significant advantage of pivot tables is that they make it possible to summarise data in a fast and straightforward way. In the case of unstructured data, the table assists in creating a brief summary from thousands of rows and columns of data. With the assistance of these tables, you may condense a large quantity of information into a small amount of physical space.
The information may be summarised in a straightforward manner that is readily comprehendible. Users may organize rows and columns of data according to their requirements, and they can name and categorize it in any way that they see fit.
Identifying Data Patterns
Excel pivot tables allow you to build customized tables from big data groups by combining several data groups. This method of manipulating data will aid in the discovery of recurrent patterns in the data if any exist. This, in turn, will help in the precise forecasting of data.
Creating a Report in Minutes
A significant advantage of using pivot tables in Excel is that they make it easier to generate reports more efficiently. This saves you the arduous and time-consuming hours that you would otherwise have to spend manually generating reports. Additionally, the table assists you in including connections to external sources in the information you are creating, if any exist.
Aids in the Making of Quick Decisions
A pivot table may be a useful Excel reporting tool since it enables users to quickly evaluate data and make choices based on the information they have. This is a significant benefit in the industrial sector, where it is critical to make accurate and timely choices to stay competitive.


