Fund flow analysis is one of the simplest and the basic tools for stock analysis. Fund flow analysis helps investors in identifying the key areas of utilization of funds for a company during any period along with the key sources of those funds. Fund flow analysis provides a great help to investors in finding companies, which are giving loans to promoters/related parties, doing significant capital expenditure, investments in subsidiaries etc.
More importantly, fund flow analysis helps the investors in identifying from where the company got this money, which it is now giving as loans to promoters/related parties/subsidiaries etc. An investor can easily find out whether the company is giving away the money, which it earned in profits or it is taking costly loans from banks and then forwarding this money to promoters/related parties. If the company is taking loans from banks to give it to promoters, then an investor would note that the company is doing so at the cost of public shareholders. This is because, the benefits of the money are being enjoyed by the promoters, whereas it will be the company (including public shareholders) who will have to repay the loan & interest to the banks.
Therefore, we believe that the simple exercise of fund flow analysis can help an investor check the shareholder friendliness, integrity and honesty of the promoters/management within a short period of time. As is usually said, “To know the truth, follow the money“. Therefore, fund flow analysis is the tool, which lets investors follow the money and bring to the light a lot of hidden aspects of the promoter/management decisions. This in turn lets the investor know whether her interests are being cared for by the company/management.
The current article provides introduction to fund flow analysis with a real life examples of a companies as live demonstration of the concept. The article also provides answers to some of important queries related to fund flow analysis asked by investors.
Funds Flow Assessment
Movement of funds in the company’s balance sheet can be assessed by doing a comparative assessment of different sections of the balance sheet. An investor should compare the values of every section at the reporting date of current year and the previous year and calculate the change in their values.
1) Equities and Liabilities:
In the liabilities section, any increase in an item means that the company has received funds (inflow), which need to be paid to external parties like:
shareholders (equity and reserves),
lenders (long term debt, short term debt etc),
vendors (trade payables),
customers (advances from customers usually part of other current liabilities)
employees (leaves, gratuity etc. as part of short term provisions)
Similarly, a decrease in any item in the liability section means that the funds have gone out (outflow) from the company to third parties to satisfy the existing liability.
2) Assets:
In the assets section, any increase in an items means that the company has spent funds (outflow) to purchase assets, which would generate cash/funds inflow in future like:
Fixed assets (purchase of plant and machinery)
Long term loans & advances/Non-current investments (investments in long term financial products, JVs, subsidiaries etc.)
Current Investments (investments in short term financial products)
Inventory (raw material)
Trade receivables (payment due from customers)
Cash & equivalents (bank balance)
Short term loans & advances (loans to related parties, vendors etc.)
Similarly, a decrease in any item in the assets section means that the funds have come into the company (inflow) from third parties by way of sale of assets or collection of dues from third parties.
This contrasting interpretation of directional change (increase/decrease) in items in liabilities and assets sections and their impact on funds statement (inflow/outflow) becomes confusing for many investors. Therefore, it is essential that the reader spend extra care while interpreting the funds flow analysis.
To understand further, let’s do the fund-flow analysis on the summary balance sheet of Ambika Cotton Mills Limited, which it disclosed with March 31, 2016 results:
Fund Flow Analysis of Ambika Cotton Mills Limited
To simplify the matter, all the items depicting funds inflow have been shown in “Green” and all the items leading to funds outflow are shown as “Red”

The fund-flow analysis depicts that Ambika Cotton Mills Limited, has received funds of about ₹75.6 crores from:
reserves (net profits – dividends paid): ₹33.8 crores
inventory (used in creating goods for sales): ₹20 crores
fixed assets (depreciation – non cash expense in P&L): ₹14.8 crores
long term loans & advances (recovered money back, sold long financial products): ₹7 crores
The analysis also indicates that these funds have been used by the company in the period under analysis (March 2015 to March 2016) in the following manner:
payment of long term debt: ₹3.7 crores
payment of short term debt: ₹26 crores
payment of other current liabilities (primarily current maturity of long term debt and customer advances that are recognized as sales and therefore removed from balance sheet liabilities: see the section below): ₹13 crores
payment of trade payables to the vendors: ₹4 crores
providing credit to customers (trade receivables): ₹12.5 crores
deposits in banks (cash and equivalents): ₹2 crores
given as short term loans and advances: ₹2 crores
Other current liabilities section of the FY2015 annual report of Ambika Cotton Mills Limited, showing current maturity of long term debt and other items in the composition of other current liabilities section:

The fund flow analysis for Ambika Cotton Mills Limited indicates that during FY2016, the primary sources of funds for Ambika Cotton Mills have been profits (reserves) and liquidation of inventory, which it has used to repay debt (short term, long term and current maturity of long term debt) and providing credit to customers.
This pattern of funds flow indicate normal operations of a healthy profitable company where the management is using the funds generated from the company into company operations.
Fund flow analysis has the potential of highlighting and early stage identification of cases where management uses funds generated from the company (profits/reserves and debt) for its own benefits in form of loans and advances to group companies/promoter entities.
The case of Gujarat Automotive Gears Limited (GAGL) is a pertinent example of funds diversion by the promoter/management, in which the majority shareholder/promoter/management took out the profits of GAGL and made it take debt, which GAGL did not need for its operations and used these funds to give loans to themselves. Promoters of GAGL (HIM Teknoforge Limited) in turn benefited at the cost of GAGL shareholders.
We highly recommend that an investor should read the detailed analysis of GAGL in which the funds diversion was identified by way of funds flow analysis in the following article:
Read: Why Management Assessment is the Most Critical Factor in Stock Investing?
We are providing a section of the fund flow analysis of GAGL below to help investors understand the immense help provided by fund flow analysis in the management analysis of any company:
Fund Flow Analysis of Gujarat Automotive Gears Ltd
Gujarat Automotive Gears Limited is a small cap company with market capitalization of ₹33 cr. it was established in Baroda in 1973. The company makes auto and tractor components including transmission gears and axle shafts. Its products target OEMs and after-markets in India and sell under the brand name of KAG in India. The company also exports its products and has United States of America, Germany, Italy, United Kingdom, Belgium, Egypt, Dubai, Sri Lanka, Singapore, Malaysia, Thailand, Australia etc. as its overseas markets.
Analysis of Gujarat Automotive Gears Limited revealed that it was a great business. The following financial performance would reflect that the company has been showing the picture perfect image of a good business:
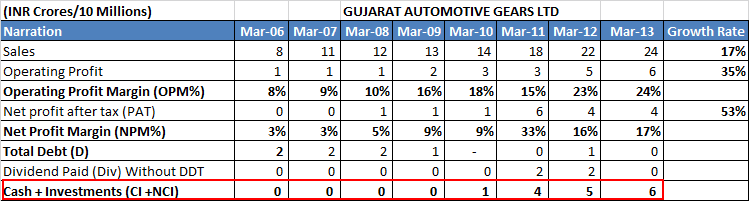
Sales had been increasing at a good pace (17%)
Profits had been increasing at even higher pace
All the profitability margins were at respectable levels and were improving further
The company was a debt free company and
Has a cash chest, which was swelling year on year because its business was a cash cow.
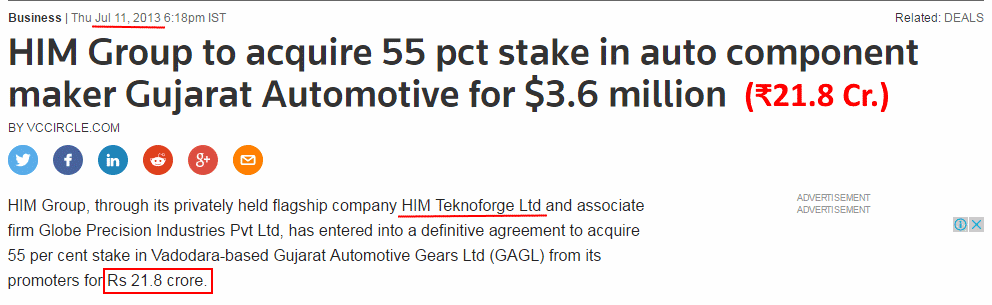
Such a business is always a prize catch to investors and there was no surprise that in July 2013, the company was acquired by HIM Teknoforge Limited for ₹21.8 cr. when it purchased the 55% shareholding of erstwhile promoters.
The company went on with its business as usual under the new promoters and finished the next year, FY2014, by generating the highest ever sales of ₹29 cr. and profits of ₹5 cr.
However, the investors were in for a surprise when the balance-sheet of Gujarat Automotive Gears Limited at March 31, 2014 was made public and it showed that the cash holding has reduced from ₹6cr. in FY2013 to ₹1 cr. in FY2014.
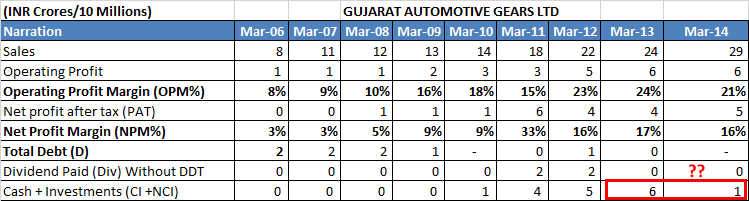
The usage of cash remained a key issue to be found out as the company has not used it to pay dividend to its shareholders.
The analysis of the balance sheet at March 31, 2014 showed that Gujarat Automotive Gears Limited has utilized its existing cash reserves (decline by about ₹5 cr.) as well as the profits generated in the year FY2014 (increase in reserves & surplus of about ₹4.5 cr) to provide loans & advance to some entity (increase by about ₹10 cr.).
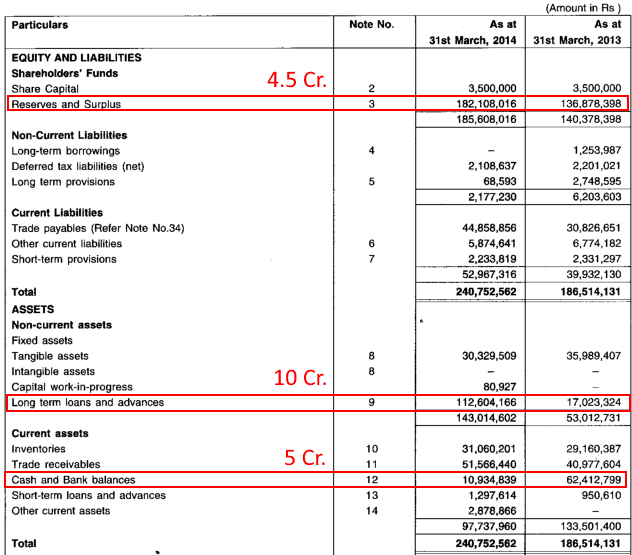
Balance sheet of Gujarat Automotive Gears Limited showed that it had only about ₹3 cr invested in the fixed assets used to make products to generate its sales & profits, whereas it has given a loan of about ₹10 cr to some entity.Such kind of loan, which makes loan assets more than fixed assets reflected that the management of Gujarat Automotive Gears Limited is finding more value in lending the money than investing it in its core business.
Read: Understanding the Annual Report of a Company
As this business decision of the Gujarat Automotive Gears Limited had important implications, it becomes imperative for any investor to find out who is the entity to whom this loan has been given.
The investors could find these details in the annual report of Gujarat Automotive Gears Limited for FY2014, in a section called “Related Party Transactions”:
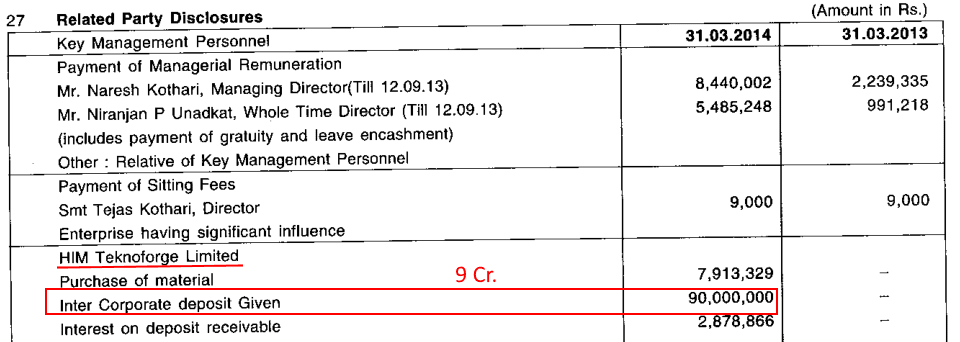
Details in the related party transactions section revealed that Gujarat Automotive Gears Limited has given a loan (inter corporate deposit) of ₹9 cr. to HIM Teknoforge Limited in FY2014.
This action by Gujarat Automotive Gears Ltd meant that it has used its cash reserves and its entire profits for FY2014 and used it to give a loan to HIM Teknoforge Limited. HIM Teknoforge Limited is no one but the new promoter of Gujarat Automotive Gears Limited, who has acquired it in July 2013 by buying 55% of the shares in the company.
It effectively meant that the new promoter, HIM Teknoforge Limited, within a few months of acquisition of Gujarat Automotive Gears Limited has used it as a source of funds (to the extent of ₹9 cr) to serve the purposes of HIM Teknoforge Limited. I doubt that minority shareholders could have controlled the loan, which HIM Teknoforge Limited being the management & largest shareholder, made Gujarat Automotive Gears Limited to give to itself.
When an investor continues further with the fund flow analysis of Gujarat Automotive Gears Ltd for next few years as highlighted in the article: Why Management Assessment is the Most Critical Factor in Stock Investing?, then she notices that within next 3 years, the new promoter, HIM Teknoforge Ltd, took out more than ₹25 cr. from GAGL, which is even more than ₹21.8 cr, which it paid to acquire control of GAGL.
The fund flow analysis in the above case shows that GAGL has effectively funded its own acquisition. This is because over next 3 years, it the company has given more money than the acquisition cost to the new promoter.
Therefore, we believe that along with a very good financial analysis tool, the fund flow analysis is a very important tool for management analysis. This is because it helps investors understand what is the company doing with the money; from where it is raising the money and where it is using the money. Fund flow analysis opens up answers to a lot of such questions, which are otherwise never resolved for investors.
In addition, investors would note that fund flow analysis also provide inputs about:
whether the debt position of the company is improving or deteriorating by observing increasing or decreasing debt levels
whether the receivables position of the company is changing for better or worse by noticing increase or decrease in trade receivables when compared with sales performance
Status of project progress:
In case capital work in progress (CWIP) is increasing, it would mean that the work on project under implementation is progressing
In case CWIP has decreased and net fixed assets (NFA) has increased, it would mean that most probably the under construction project has been completed and has been transferred from CWIP to NFA
Thus an investor can get multiple useful information points even from the cursory overview of summary balance sheet disclosed with financial results.
In light of the above, we believe that it is essential for every investor to conduct fund flow analysis on the companies she analyses for investing. It is simple but very effective tool to understand the management intentions, integrity and shareholder friendliness.
Let us now get further clarifications to the concept of fund flow analysis by answering important queries asked by investors:
Readers’ Queries about Fund Flow Analysis
How to determine equity contribution in Fund Flow Analysis?
Hi Dr. Malik,
I learned fund flow analysis from your class in Bangalore and I am trying to implement it for KRBL Ltd. However, I am unable to figure out which number needs to be used when calculating “Equity”. Should we be using:
The difference between last year’s equity and current year’s equity or
PAT for the current year to come to a conclusion?
I have attached an image of my analysis for your perusal. Any help would be much appreciated 
Regards,

Author’s Response:
Hi,
Thanks for writing to us!
In the case of fund flow analysis, while comparing the balance sheet of two years, we use the difference in the Equity (equity is the sum of equity capital and reserves & surplus).
Further advised reading: Understanding the Annual Report of a Company
The change in equity would be a result of retained earnings (PAT – dividend including dividend distribution tax) and other sources like equity raising due to IPO/FPO etc. or equity reduction due to buybacks etc.
We cannot use PAT straightaway in fund flow analysis because as mentioned above, a few other things other than PAT would also impact equity: like dividend distribution, equity raising or equity reduction etc.
All the best for your investing journey!
Regards
Dr. Vijay Malik
Will the fund inflow and fund outflow be always equal?
Dear Dr. Malik,
Many thanks for this article. Though I read funds flow statement in MBA, never really applied it while analysing a company. Of course, I used to look at the movement of assets and liabilities, and check the cash flow statement, however, putting it down and seeing the movement does help. I have already incorporated this to a few companies that I am tracking now.
Just one question. When we check the overall figure, should the funds received be greater than or at least equal to funds used, for us to safely infer that the company is using the primary source of funds to repay debt? Have you come across any instance where the total funds used is greater than total funds received? Sorry if this is a stupid question. Thanks a lot.
Author’s Response:
Hi,
Thanks for writing to me! I am happy that you found the article useful.
I am happy that you have started using the funds flow in your stock analysis. It is a very good tool to weed out shareholder unfriendly managements.
The funds movement also follows double entry system and therefore, the sources of funds (received) will always be equal to usage of funds (usage). In the above example, I have done some rounding off, therefore, there might be some mismatches in receipts and usage. Otherwise, if you conduct this exercise by transferring the summary balance sheet in excel, then usage would match the receipts.
Hope it clarifies your queries! All the best for your investing journey!
Regards,
Vijay
P.S.
To know about the stocks in our portfolio, you may subscribe to the premium service: Follow My Portfolio with Latest Buy/Sell Transactions Updates
To learn our stock investing approach “Peaceful Investing” by videos, you may subscribe to “Peaceful Investing” Workshop-on-Demand
To download our customized stock analysis excel template: Click Here
Learn about our stock analysis approach in the e-book: “Peaceful Investing – A Simple Guide to Hassle-free Stock Investing”
Read more company analysis in the e-book series: Company Analyses
To register for our upcoming full-day “Peaceful Investing” workshop teaching in-depth fundamental analysis & portfolio management: Click Here
To pre-register free/express interest for an investing workshop in your city: click here
DISCLAIMER
The above discussion is only for educational purpose to help the readers improve their stock analysis skills. It is not a buy/sell/hold recommendation for the discussed stocks.
I am registered with SEBI as an Investment Adviser under SEBI (Investment Advisers) Regulations, 2013.
Currently, I do not own any of the stocks of the companies mentioned above, except Ambika Cotton Mills Ltd. in my portfolio.
The post Fund Flow Analysis: The Ultimate Guide appeared first on Dr Vijay Malik.


