Crypto options trading is gaining popularity among traders who want more flexibility than spot or futures markets. To trade options effectively, you must understand how to read call and put data inside an options chain. Whether you're using one of the popular crypto exchanges or searching for the best crypto trading platform in India, mastering options chain analysis can significantly improve your decision-making.
In this guide, we’ll break down everything in simple terms.
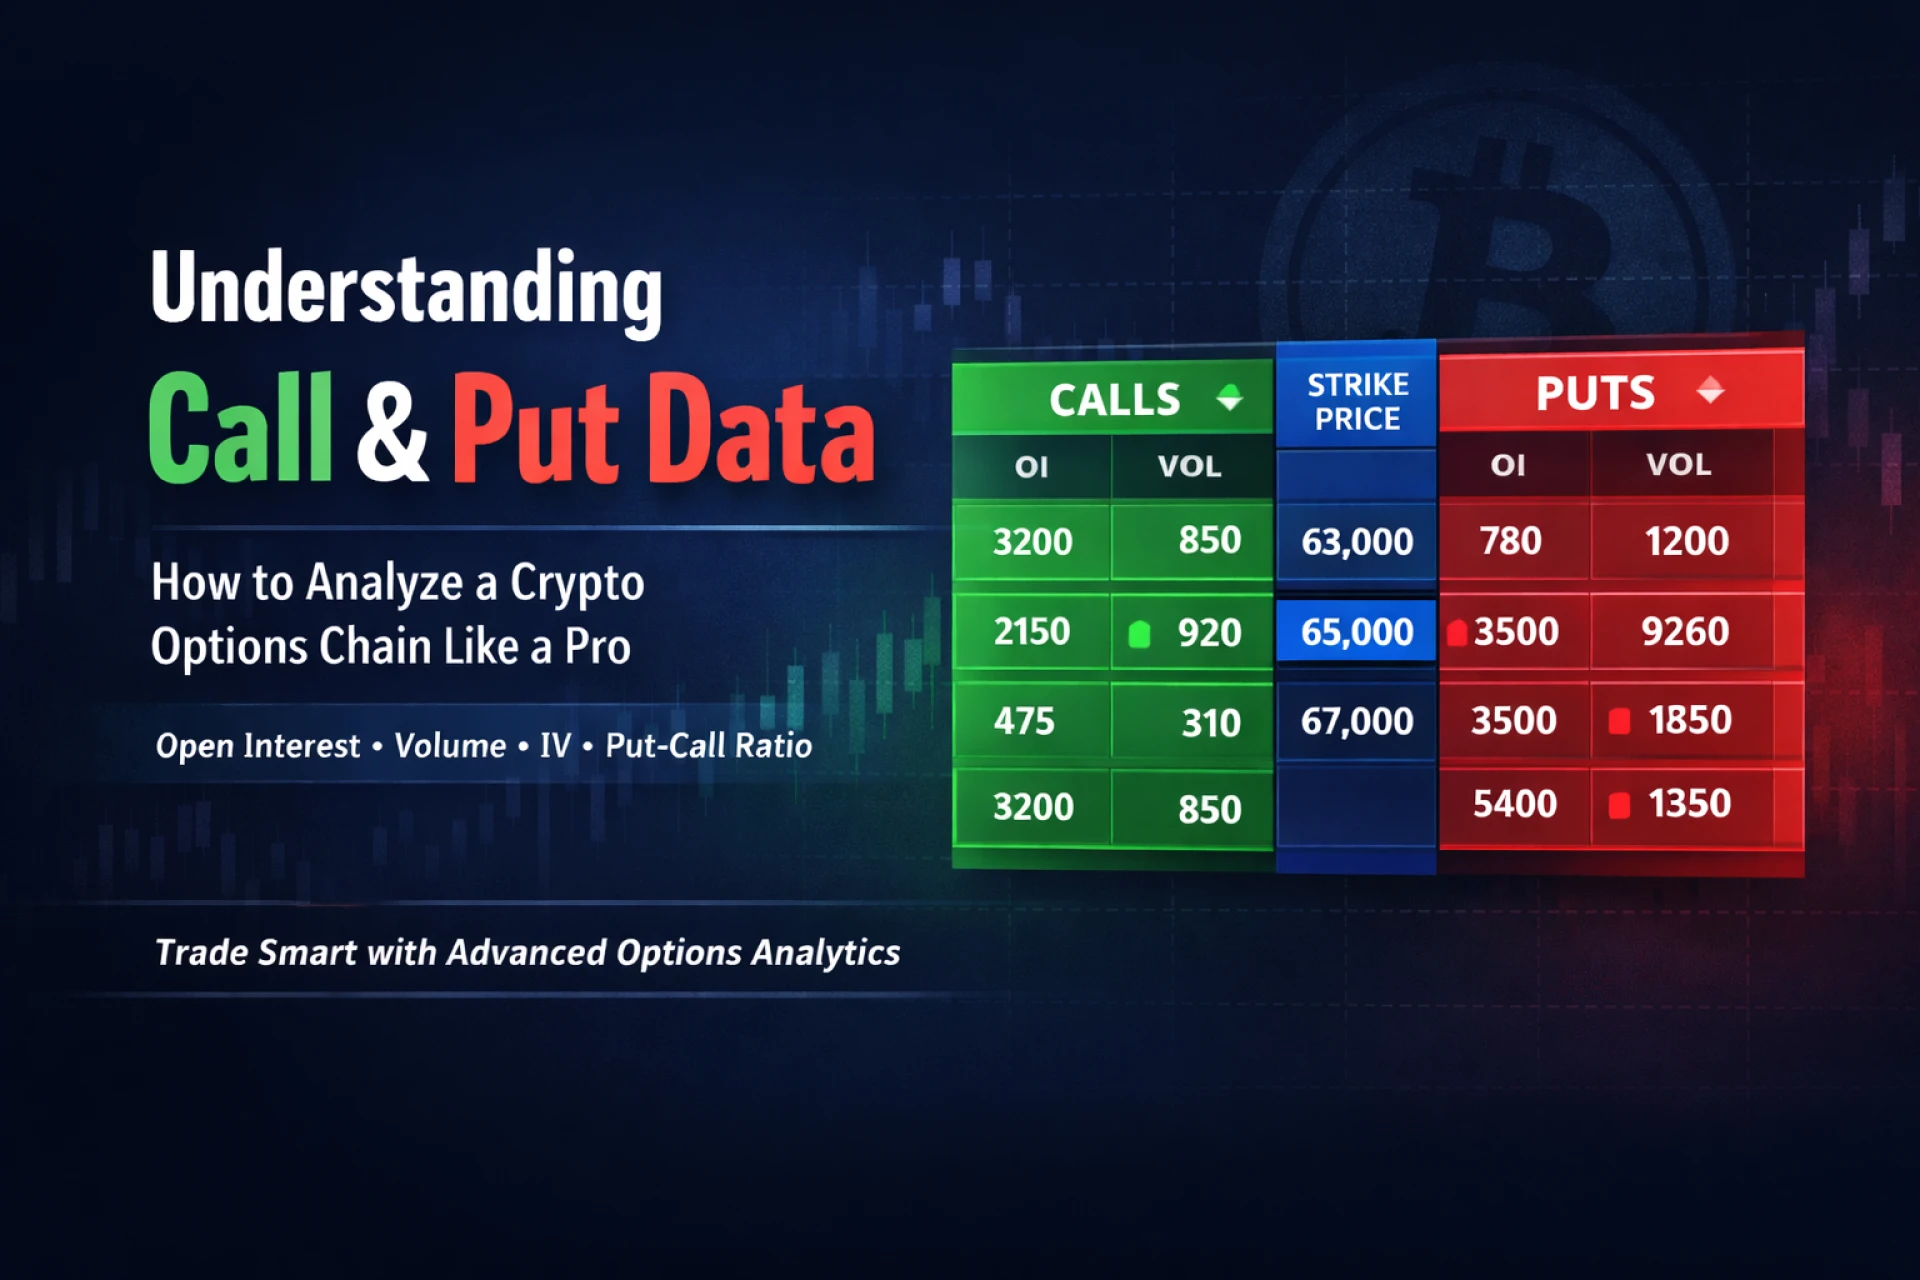
What Is a Crypto Options Chain?
A crypto options chain is a structured table that displays all available call and put contracts for a particular cryptocurrency (like Bitcoin or Ethereum), across different strike prices and expiry dates.
It typically includes:
- Strike Price
- Call Option Data
- Put Option Data
- Open Interest (OI)
- Volume
- Implied Volatility (IV)
- Last Traded Price (LTP)
Platforms like Delta Exchange provide detailed options chain data, helping traders make informed decisions with real-time insights.
Understanding Call Options Data
A call option gives the buyer the right (but not the obligation) to buy an asset at a specific strike price before expiry.
Key Call Option Metrics to Watch:
1. Open Interest (OI)
Open Interest shows the total number of active call contracts.
- Rising OI + rising price → Strong bullish sentiment
- Rising OI + falling price → Possible short build-up
High call OI at a certain strike price often acts as resistance.
2. Volume
Volume represents the number of contracts traded during a session.
Higher volume indicates strong market interest at that strike level.
3. Implied Volatility (IV)
IV reflects expected price movement.
Higher IV means higher option premiums.
On platforms like Delta Exchange, traders can easily track IV changes to identify volatility spikes.
Understanding Put Options Data
A put option gives the buyer the right to sell an asset at a specified strike price before expiry.
Key Put Option Metrics to Watch:
1. Open Interest (OI)
High put OI at a strike price often indicates strong support.
- Rising put OI → Traders expect downside protection
- Falling put OI → Reduced bearish sentiment
2. Volume
Large put volume suggests increased hedging or bearish bets.
3. IV in Puts
If IV in puts increases sharply, it may indicate fear in the market.
When analyzing Bitcoin or Ethereum contracts on popular crypto exchanges, tracking put data helps gauge market risk sentiment.
What Is the Put-Call Ratio (PCR)?
The Put-Call Ratio (PCR) compares total put OI to total call OI.
- PCR > 1 → More bearish sentiment
- PCR < 1 → More bullish sentiment
Extreme PCR levels may indicate potential reversals.
Many traders on Delta Exchange use PCR as a sentiment indicator before taking directional positions.
How Call and Put Data Help Identify Support & Resistance
Options chain data can act as a psychological price map:
- Highest Call OI → Potential Resistance
- Highest Put OI → Potential Support
For example:
- If BTC has maximum call OI at ₹65,000 → Sellers may defend that level.
- If maximum put OI is at ₹60,000 → Buyers may support that level.
This technique is widely used on the best crypto trading platform in India to plan entry and exit points.
How to Use Options Chain Data for Trading
Here’s a simple process:
Step 1: Identify Highest OI Levels
Look at strike prices with maximum call and put OI.
Step 2: Check OI Changes
Are traders adding positions or closing them?
Step 3: Monitor Volume Spike
Sudden volume increase signals fresh interest.
Step 4: Compare IV Levels
Rising IV before events indicates expected volatility.
A good crypto exchange will provide real-time data, clean UI, and advanced tools for deep analysis. Delta Exchange offers structured options data that helps both beginners and advanced traders interpret market sentiment effectively.
Common Mistakes While Reading Options Chain
- Ignoring expiry dates
- Looking only at OI without price context
- Misinterpreting PCR at extreme levels
- Trading without risk management
Even on popular crypto exchanges, traders often lose money due to incomplete analysis.
Why Options Chain Analysis Matters
Understanding call and put data gives traders:
- Better market sentiment insights
- Clear support and resistance zones
- Improved risk management
- Strategic trade planning
If you’re trading on the best crypto trading platform in India, combining options chain data with technical indicators like RSI or MACD can significantly enhance accuracy.
Final Thoughts
Reading a crypto options chain may look complex at first, but once you understand call and put data, it becomes a powerful trading tool. Monitoring open interest, volume, IV, and PCR can help you predict potential price movements and market psychology.
Whether you're trading Bitcoin or Ethereum, using structured analytics from a good crypto exchange like Delta Exchange can help you build smarter strategies. With the right approach and disciplined risk management, options chain analysis can become one of your most valuable trading skills.


Sign in to leave a comment.