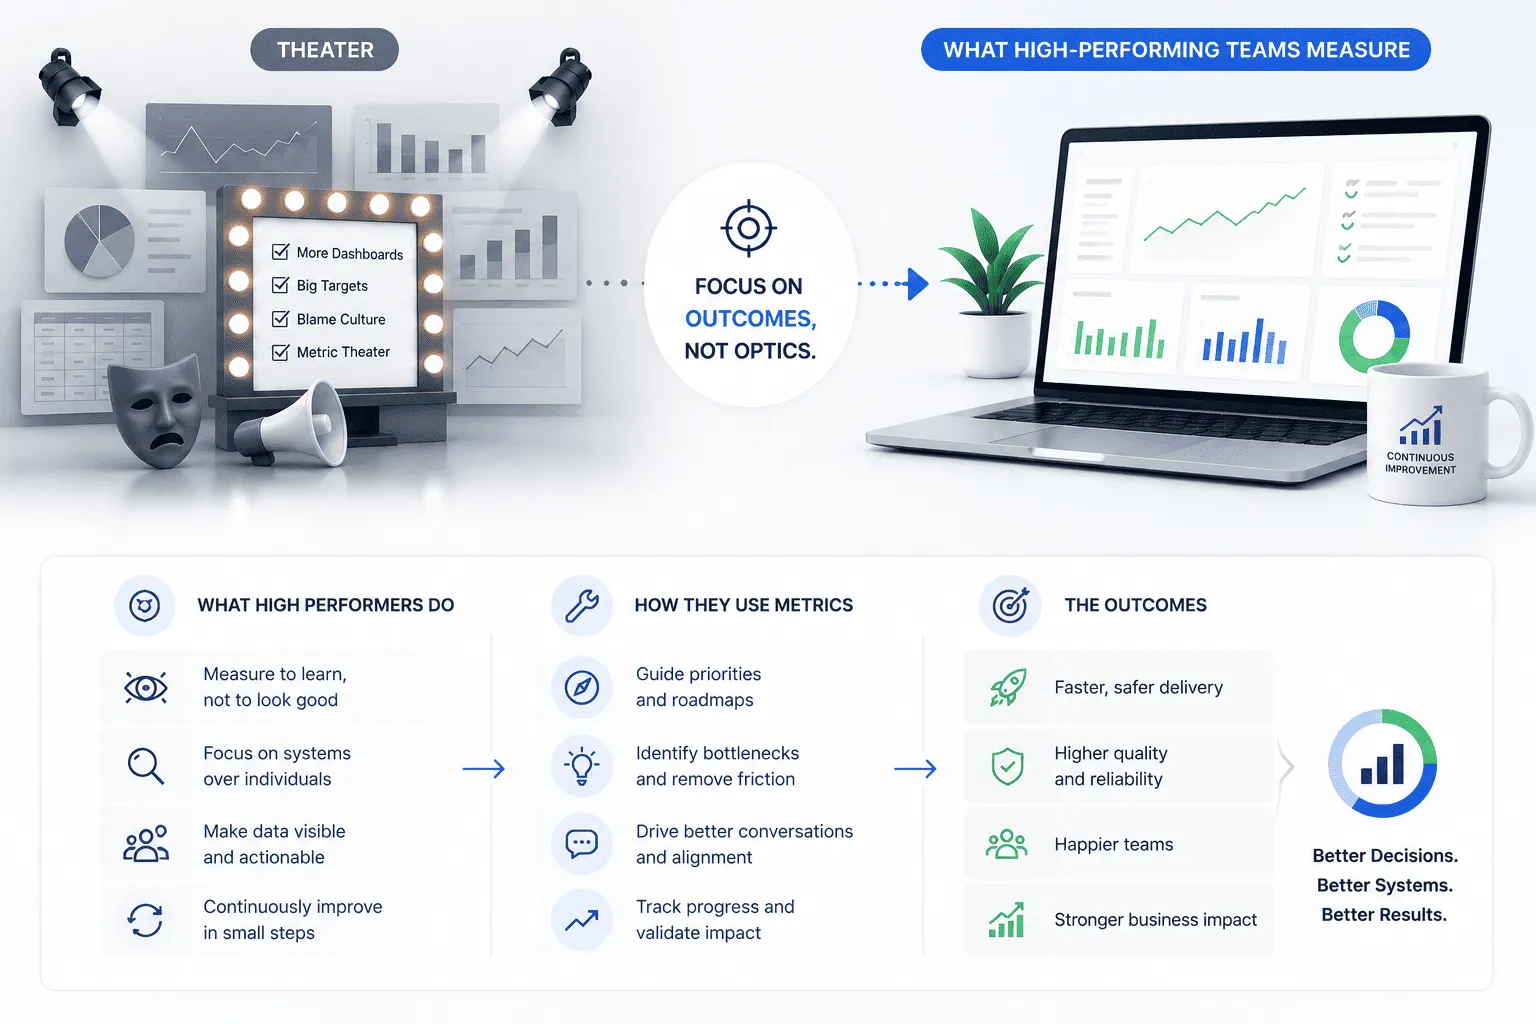

A team notices their change failure rate climbing. Deployments are breaking production more often than they did six months ago. Leadership wants the number fixed. The team spends three weeks improving the deployment pipeline. Better rollback automation. Faster incident detection. Cleaner staging environments. The change failure rate drops slightly. Everyone celebrates.
Three months later it climbs again.
This pattern repeats across organizations working on DORA metrics improvement. Teams treat the metric as the problem when the metric is actually the report card. The underlying problem that generates bad report cards keeps generating them because nobody touched it.
In most cases, that underlying problem is testing strategy.
What DORA Metrics Are Actually Reporting
Understanding why testing strategy sits at the root of most DORA metrics problems requires understanding what each metric is actually measuring.
Deployment Frequency measures how often code reaches production. Low frequency is often blamed on slow pipelines, bureaucratic approval processes, or risk-averse culture. These are real contributors. But deployment frequency is also constrained by confidence. Teams deploy less often when deployments are risky. And deployments are risky when testing does not adequately validate what will happen in production.
Lead Time for Changes measures the time from code commit to production deployment. Long lead time is often blamed on slow code review, long test execution, or manual approval stages. These are real contributors. But lead time is also affected by the time teams spend investigating test failures that turn out to be false alarms, updating assertions that drifted from actual system behavior, and maintaining test infrastructure that consumes engineering hours without producing reliable signal.
Change Failure Rate is the most direct testing quality signal in the entire DORA framework. Every time a deployment causes a production failure, it means something reached production that testing did not catch. High change failure rate is a direct statement that the test suite is not covering what matters. That statement is rarely interpreted that way. It is more commonly interpreted as a deployment problem, an infrastructure problem, or a monitoring problem.
Failed Deployment Recovery Time measures how long it takes to restore service after a production failure. Slow recovery is often blamed on incident response processes, on-call availability, or observability gaps. These are real contributors. But recovery time is also affected by how well teams understand what changed. When tests are built on predictions about expected behavior, failures produce cryptic mismatches between predicted and actual values. When tests are built on observed behavior, failures point to specific behavioral changes that make diagnosis faster.
Deployment Rework Rate, the newest DORA metric added in 2024, is the most direct testing signal of all five. It measures how much pipeline capacity is consumed fixing work previously considered complete. Rework happens when something passes testing and then fails in production. The definition of rework is the definition of a test suite that did not reflect production reality.
Every DORA metric has a testing dimension. Most improvement initiatives never reach it.
The Symptom Treatment Cycle
Treating DORA metrics without addressing testing creates a recognizable cycle.
Metrics look bad. Teams investigate the deployment pipeline. They add staging environment improvements. They add faster rollback capabilities. They add better monitoring. Metrics improve temporarily. The underlying testing gaps remain. New code that the tests cannot adequately validate keeps reaching production. Change failure rate creeps back up. The cycle repeats.
This cycle is not unique to software development. Medicine has a parallel. A patient has recurring infections. The doctor prescribes antibiotics each time. The infections clear. They return. Eventually someone asks whether the patient's immune system is the real problem rather than any individual infection. The answer changes the treatment.
DORA metrics are the recurring infections. Testing strategy is the immune system. Treating individual metric dips without building stronger testing is antibiotic therapy for an immune deficiency.
The analogy is imperfect. But the logical structure holds. Sustainable improvement requires addressing the system that generates the outcomes, not the outcomes themselves.
I have observed teams run three consecutive DORA improvement initiatives without touching their test strategy. Each initiative produced measurable short-term improvement. Each was followed by regression toward the previous baseline. The pipeline was not the constraint. The testing strategy was. And the testing strategy never changed.
Why Testing Strategy Drives DORA Metrics
The connection between testing strategy and DORA metrics runs through one fundamental question: does your test suite validate what your system actually does, or does it validate what you predicted your system would do?
Prediction-based testing is the dominant approach. Teams write tests before or alongside code. They predict what the code should do. They write assertions encoding those predictions. The tests validate the predictions. When predictions are accurate and complete, this works. When they are not, tests pass while production fails.
Prediction-based testing has a structural ceiling on change failure rate. No matter how many tests a team writes, predictions will always miss some production scenarios. Real users send requests that test authors did not anticipate. Real data has distributions that test fixtures do not represent. Real concurrent usage creates conditions that sequential test design cannot surface. These gaps are not failures of effort. They are structural limits of prediction.
The change failure rate for teams relying entirely on prediction-based testing reflects those structural limits. There is a floor below which change failure rate does not drop regardless of how many more predictions the team encodes. Teams hit this floor and wonder what else they can do to improve the metric. They look at infrastructure. They look at deployment processes. They rarely look at what the tests are built on.
Observation-based testing removes the ceiling by removing the reliance on prediction. Instead of asking what the system should do and encoding that prediction, it asks what the system actually does and uses that observation as the test specification. Real requests that arrive in production get captured. Real responses get recorded. Real dependency interactions get preserved. Tests then validate that this observed behavior persists across deployments.
When observed behavior is the test specification, the structural ceiling on change failure rate disappears. Coverage grows from what the system actually does rather than from what test authors imagined it might do. The gaps that prediction always leaves are filled by reality.
Keploy implements this approach by intercepting actual network traffic using eBPF and generating test cases from real API interactions. The tests reflect what the system actually does under real conditions, which is what production cares about. When something in production changes unexpectedly, the tests catch it because actual behavior diverged from recorded reality rather than because a prediction was violated.
The Rework Rate Connection
Deployment rework rate deserves specific attention because it is the DORA metric most directly explained by the prediction gap in testing.
Rework happens when something passes testing and then fails in production, requiring fixes after the fact. By definition, rework represents the failure of testing to catch real production problems before deployment.
The types of problems that generate rework share a common characteristic. They are problems that occur under real conditions that tests did not simulate. A real data distribution that the test fixtures did not represent. A concurrent usage pattern that sequential tests did not surface. A dependency behavior under load that mocked dependencies did not replicate.
These are not obscure edge cases. They are exactly the scenarios that fall into the prediction gap. Test authors predicted what data the system would receive. Real users sent different data. Test authors predicted how dependencies would behave. Real dependencies behaved differently under real load. The rework is the cost of that prediction gap materializing in production.
Reducing rework rate requires reducing the prediction gap. Not by making better predictions, which has limits, but by grounding tests in observations of what actually happens. When tests come from real traffic rather than predicted scenarios, the scenarios that generate rework are exactly the scenarios the tests cover.
Teams that track rework rate carefully discover something consistent. The rework traces back to scenarios that real users generated but test suites never encountered. The fix is not writing more predictions. The fix is capturing reality and validating it persists.
The Change Failure Rate as Testing Report Card
Change failure rate deserves similar attention as the most direct testing quality signal in the DORA framework.
Every entry into change failure rate represents a deployment that passed testing and broke production. Aggregated over time, change failure rate tells you precisely how often your test suite failed at its core job of preventing production failures.
Elite performers in the DORA research maintain change failure rates below five percent. High performers maintain rates between five and fifteen percent. Medium and low performers operate above fifteen percent. The research found that culture and practices drive these differences. But underneath the cultural and practice differences, testing quality is the mechanism.
Teams with sub-five percent change failure rates are not deploying simpler code. They are deploying code whose production behavior is better understood before deployment. That understanding comes from testing that reflects production conditions rather than predicted conditions.
The path from high change failure rate to elite change failure rate goes through testing strategy. Infrastructure improvements can move the rate from high to medium by making failures less severe or more recoverable. Moving from medium to high, and from high to elite, requires that fewer failures reach production in the first place. That requires tests that catch more of what production reveals.
This is not an argument against infrastructure investment. Faster rollback, better monitoring, and cleaner staging environments all matter. But they are treatments for the symptoms of production failures. Reducing the rate of production failures requires improving what testing validates before deployment.
What Changes When Testing Strategy Changes
The practical question is what actually changes in DORA metrics when teams move from prediction-based to observation-based testing.
Change failure rate improves because tests cover scenarios that previously reached production uncaught. Real traffic patterns become the test coverage rather than imagined patterns. The scenarios that previously generated production failures are now test scenarios because they came from production behavior.
Rework rate improves because the fixes that previously cycled back through the pipeline are caught before initial deployment. When tests reflect real behavior, the behavioral gaps that generated rework are detected during testing rather than after deployment.
Lead time improves in a non-obvious way. Prediction-based test suites accumulate false alarms. Tests that break when nothing real changed, because the predictions encoded in assertions drift from actual system behavior. These false alarms consume investigation time. When teams move to observation-based testing, false alarms decrease because tests fail only when actual behavior changes. The investigation time previously spent on false alarms frees up, and lead time improves as a downstream effect.
Deployment frequency improves as confidence in deployments increases. Teams that trust their test suite deploy more often. Trust in a prediction-based test suite is limited by the awareness that predictions have gaps. Trust in an observation-based test suite is grounded in the knowledge that the tests reflect what the system actually does.
Recovery time improves because observation-based test failures are more interpretable. When a test fails because observed behavior changed, the failure points to the specific behavioral change. That is the starting point for diagnosis. Recovery is faster when diagnosis is faster.
All five DORA metrics have a path to improvement through testing strategy. Not all of them are immediately visible. But the causal connections are there, and teams that understand them build DORA improvement initiatives that produce durable results rather than temporary metric improvements that regress.
Where to Start
Teams that recognize the connection between testing strategy and DORA metrics often face a practical challenge. Existing test suites are large. Migrating entirely to observation-based testing is a multi-month effort. Where does improvement start?
Starting with change failure rate is the most direct path. Understanding which production failures the existing test suite missed, and what those failures had in common, reveals the prediction gap in concrete terms. The scenarios that production revealed but tests never covered are exactly the scenarios to prioritize for observation-based coverage.
Rework rate analysis provides similar clarity. Each rework item represents a gap between what tests validated and what production required. Cataloguing those gaps reveals patterns in what predictions consistently miss. Those patterns are the starting point for observation-based coverage.
Neither analysis requires abandoning existing tests. Existing tests continue to catch what they catch. Observation-based coverage fills the gaps that existing tests structurally cannot fill. The combination improves DORA metrics from both directions: fewer production failures reaching the system, and faster diagnosis of the failures that do.
Conclusion
DORA metrics do not lie. When change failure rate is high, deployments are breaking production. When rework rate is climbing, testing is missing real production scenarios. When recovery is slow, teams do not know precisely what changed.
These are accurate reports. What they report is most often a testing problem dressed as a deployment problem. Teams that treat them as deployment problems improve their deployment infrastructure and watch the metrics improve temporarily. Teams that treat them as testing problems improve their testing strategy and watch the metrics improve durably.
The difference between treating symptoms and treating causes is the difference between optimizing the pipeline and building tests that reflect what the system actually does in production.
DORA metrics will keep reporting what testing keeps missing. Until testing changes, the report will not.


























Sign in to leave a comment.